
Make your first Pine Script edit
Open TradingView, create and save your first indicator, then change one number and check the result on your chart.


You will put a blue moving-average line on a TradingView chart, change one number, and see the line change. No coding experience is needed.
Use a desktop or laptop. Keep this lesson open in one browser tab and TradingView in another so you can switch between the instructions and your chart. Sign in to your own TradingView account when asked.
How to follow the pictures: red boxes show where to click in TradingView. Click a screenshot here to enlarge it; the controls inside the picture are not live. When a step says Copy, use the button on the actual code block on this lesson page.
Open TradingView and add your first indicator
Section titled “Open TradingView and add your first indicator”Open TradingView
Open tradingview.com in another tab. Click the person icon at the top right, then Sign in. Sign in to your own account, then return here. If you are already signed in, continue to step 2.
You are on TradingView's website. You have not opened the code editor yet.

Open the full chart
Click this link to open TradingView’s full chart in another tab. This is where you will add your script. You can close the TradingView homepage tab once the chart opens.
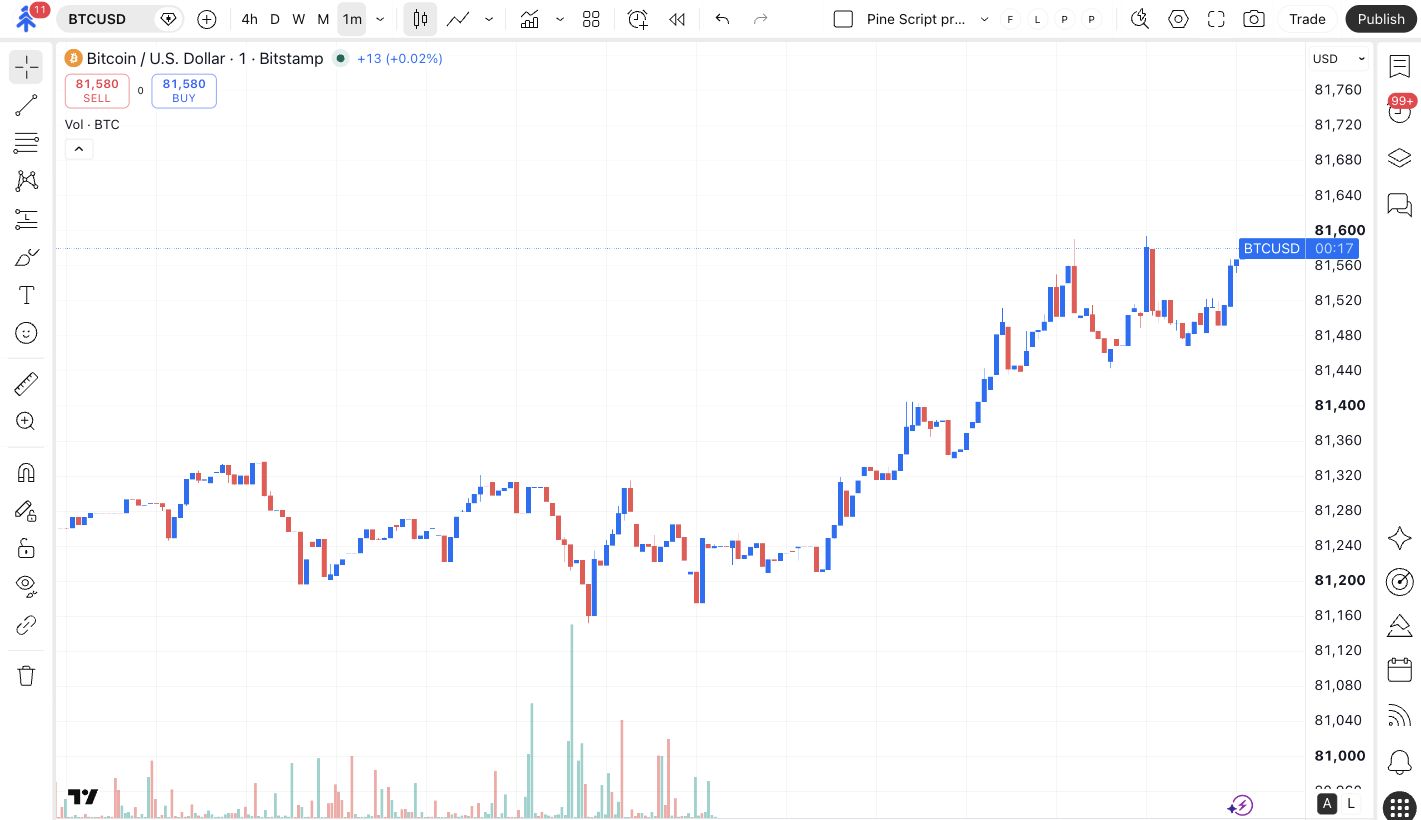
The screen has a large price chart, a symbol near the top left, and toolbars around the chart.
Still on a news page or a symbol summary? Open the full-chart link above. You need the chart workspace shown here.
Choose the example symbol
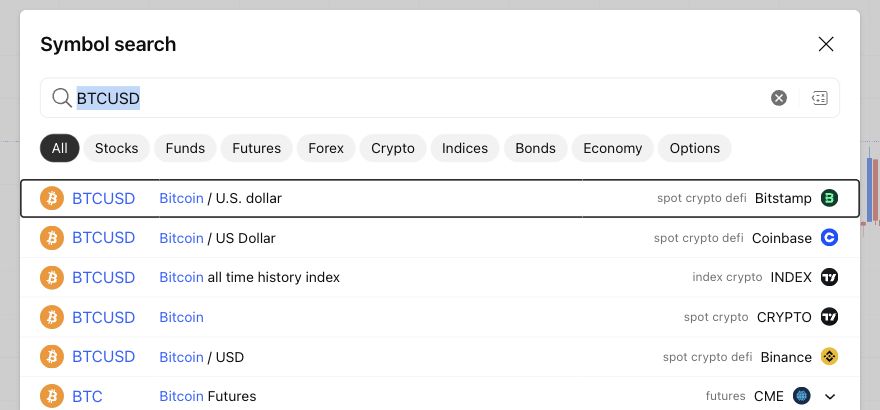
Click the current symbol at the top left of the chart. Search for BTCUSD, then choose the result from BITSTAMP. We use this same chart throughout the lessons.
The chart shows BTCUSD from BITSTAMP. Your live price and candles can differ from the screenshot.
Use 1-minute candles
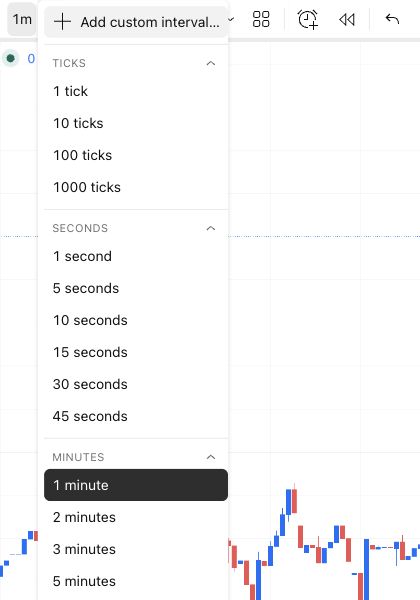
Open the interval control beside the symbol and choose 1 minute.
The chart uses a 1-minute interval and standard candles, as shown in the highlighted controls.
Next, open the chart-type menu and choose Candles.
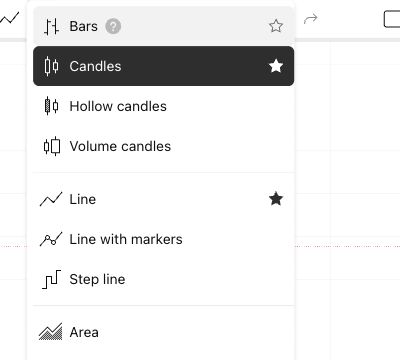
Seeing a single price line or Heikin Ashi candles? Return to the chart-type menu and choose Candles before continuing.
Open Pine Editor
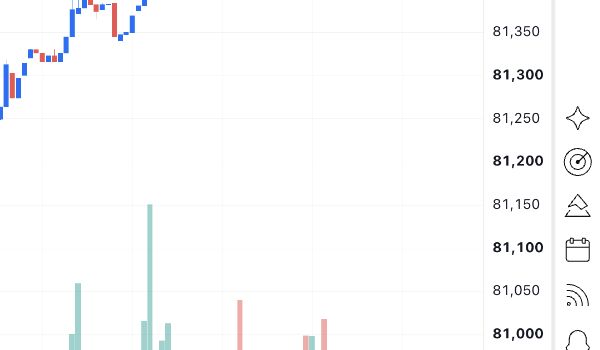
Click Pine in the chart’s right-hand toolbar.
A code editor opens beside or beneath the chart. The chart is still available.
Cannot see the control? Check that you are in the full chart from step 2, then look at the right-hand toolbar.
My screen looks different
TradingView layouts can differ. If your chart has a Pine Editor tab below the chart, open that tab. The code-editing steps that follow are the same.
Create a new indicator
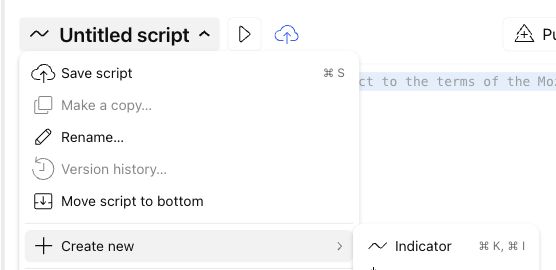
Open the script menu at the top of Pine Editor. Choose Create new, then Indicator.
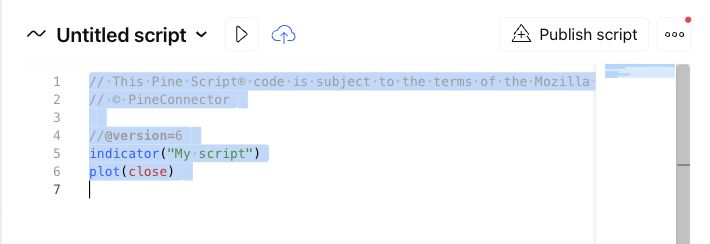
Pine Editor displays a short starter script. You will replace this starter code in the next two steps.
An indicator is a script that calculates or draws something on your chart. This one will draw a moving average. It will not place trades.
Copy the complete starting script
Section titled “Copy the complete starting script”Click Copy on the code block directly below, on this lesson page. This copies the complete script, including the first line, //@version=6.
Select all the starter code
Switch to TradingView. Click inside the code text first. Then press Cmd+A on Mac or Ctrl+A on Windows.
All of the starter code is highlighted inside Pine Editor, rather than text elsewhere on the webpage.
The whole webpage is selected instead? Click directly on a line of code, then press the shortcut again.
Paste the starting script
Press Cmd+V on Mac or Ctrl+V on Windows. This replaces the selected starter code.
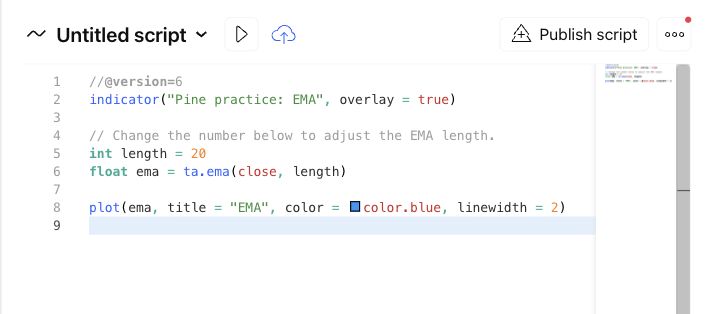
Your editor matches the eight-line example. It starts with //@version=6 and ends with plot(...).
Old code is still above or below the new code? Click inside the editor, select all again, and paste the complete script. Do not keep two scripts in the same editor.
Save your script
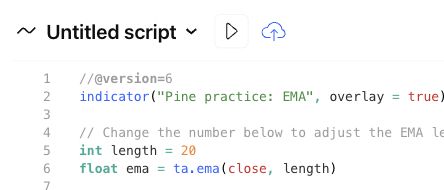
Click the cloud-shaped Save control at the top of Pine Editor. You can also press Cmd+S on Mac or Ctrl+S on Windows while your cursor is inside the editor.
TradingView asks you to name the new script.
Give it a name
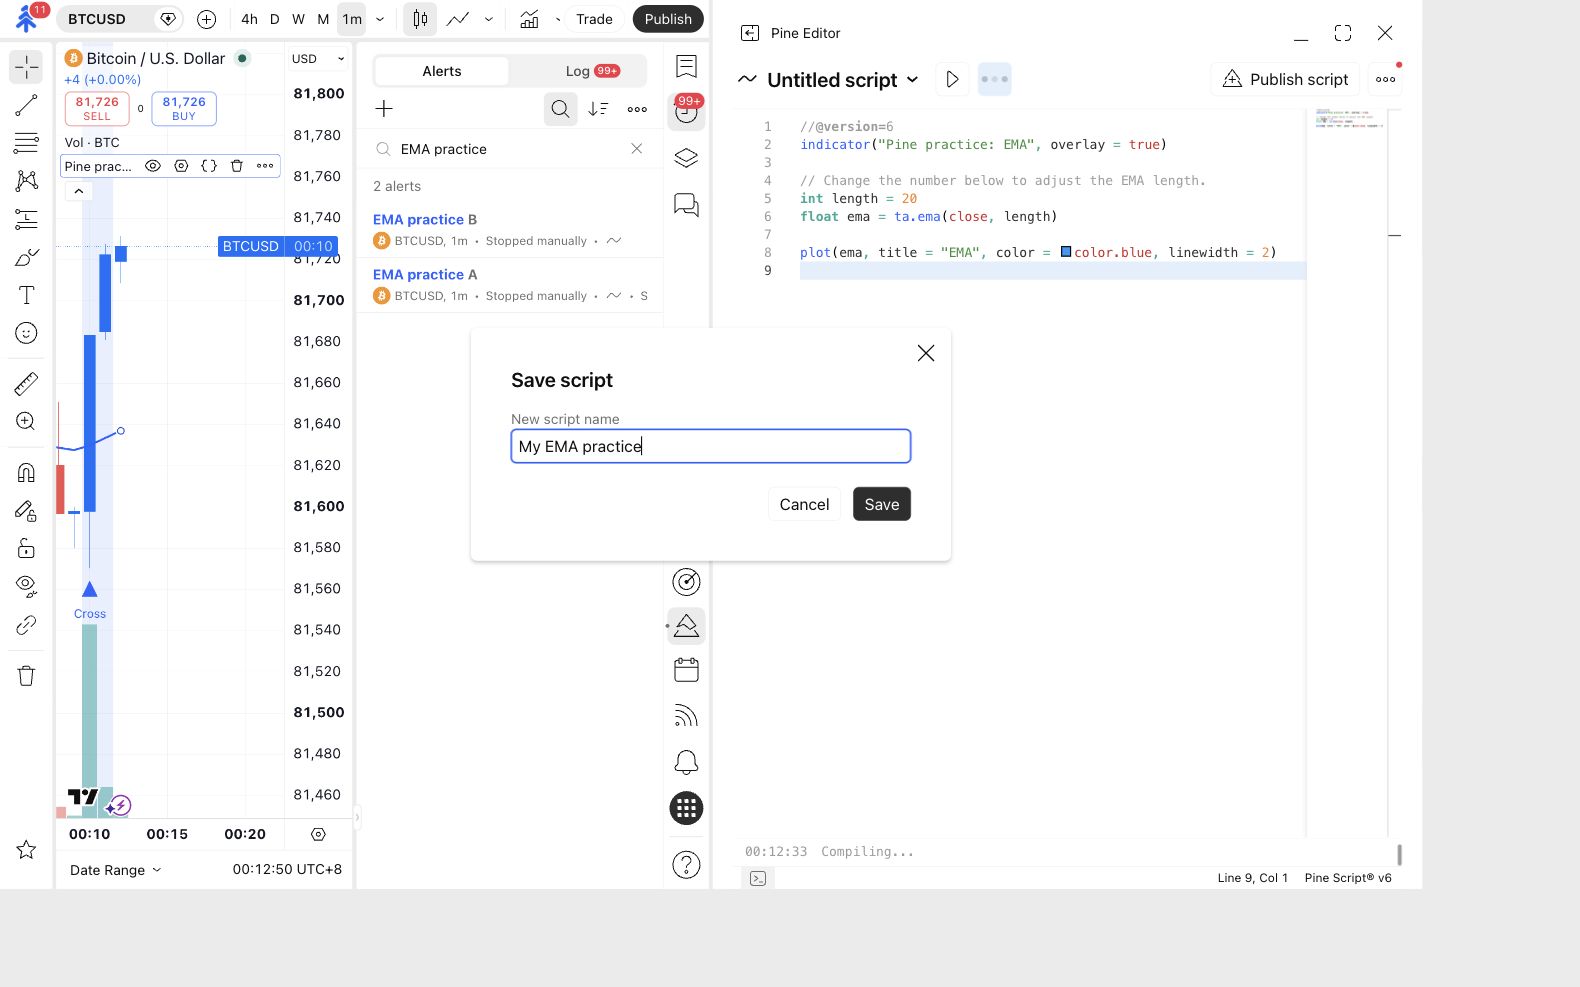
Enter My EMA practice in the name field, then click Save.
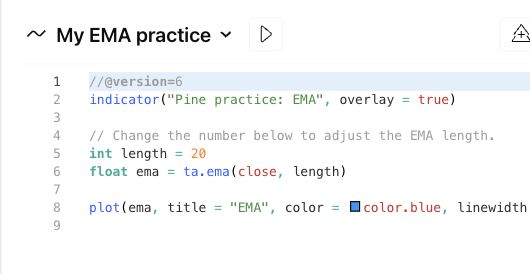
The editor shows My EMA practice as the saved script name.
A red error appears instead? Go to If an edit does not work below. Saving and drawing on the chart are separate steps.
Add the script to your chart
Click the triangle-shaped Add to chart button beside the script name at the top of Pine Editor.
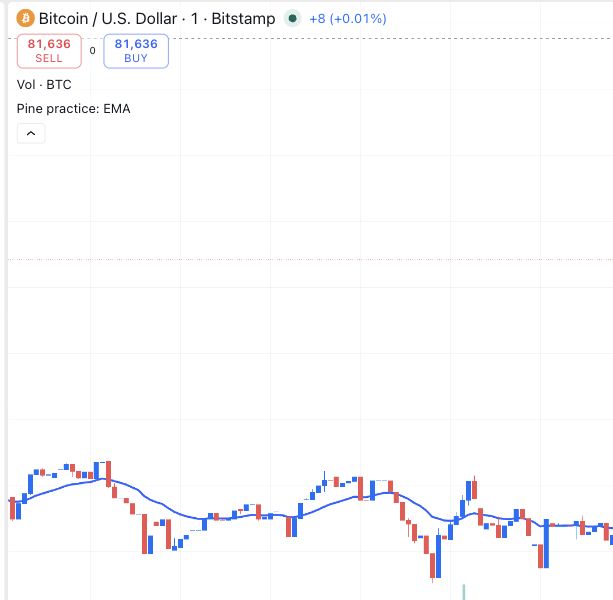
A blue line appears over the candles, and Pine practice: EMA appears in the chart's indicator list.
Check your first result
Section titled “Check your first result”Your chart should resemble this: candles, one blue EMA line, and the label Pine practice: EMA. The exact line shape depends on the prices currently on your chart.
No blue line? Check the chart’s indicator list. If Pine practice: EMA is missing, return to Pine Editor and click Add to chart. If the label is present, make sure the indicator has not been hidden.
Why are the two names different? My EMA practice is your saved file’s name. Pine practice: EMA comes from the script’s indicator(...) line and appears on the chart. Neither needs to match the other.
Make one change
Section titled “Make one change”Now change the moving average’s length from 20 to 50. Change the code first, then check the chart.
Replace 20 with 50
In Pine Editor, find int length = 20. Select only 20 and type 50.
The line now reads int length = 50. The other lines are unchanged.
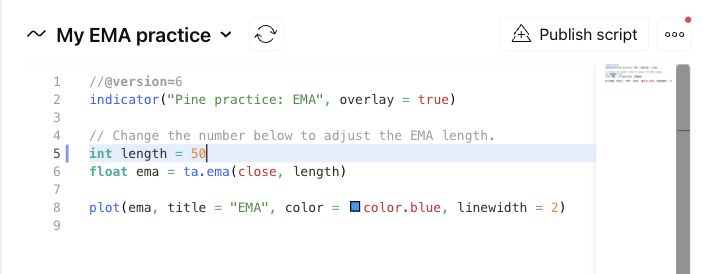
Save and check the changed line
Press Cmd+S or Ctrl+S. If the editor offers Update on chart, click it. If the script is not on the chart, click Add to chart.
Your chart uses the new length. The blue line has recalculated over the same price history.
Two copies of Pine practice: EMA? Hover over the extra entry in the chart’s indicator list and use its remove control. Keep one practice indicator so you can tell which line you changed.
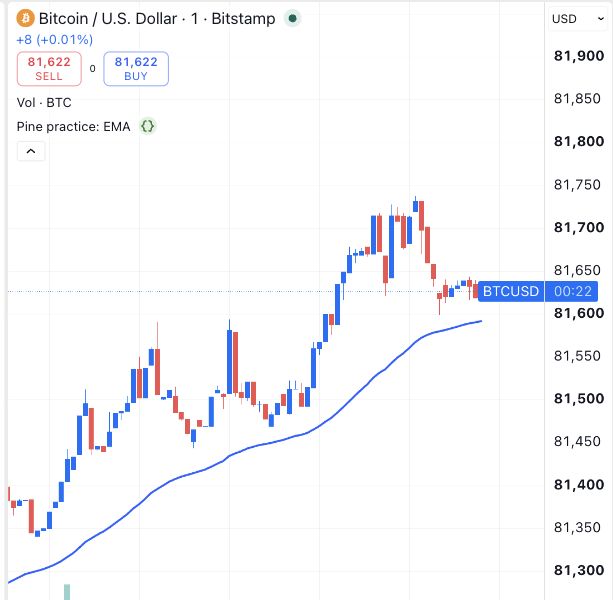
Compare this result with the length-20 chart above. A longer EMA gives each new price less weight, so it generally reacts more slowly. A changed line is a successful edit; it does not establish a profitable trading rule.
Try it yourself: change 50 back to 20, save, and check the chart again. You can use the illustration below to compare lengths over exactly the same example prices.
Change the EMA length. Watch the blue line while the grey price line stays the same.
- Latest example close
- 107.00
- EMA at that close
- 102.86
- Weight on each new close
- 9.5%
Start with length 20, then choose 50. The prices stay fixed; the longer EMA gives each new close less weight.
Fixed illustrative prices. The EMA starts at the first sample close of 100. This shows the smoothing formula, not a Pine Script runtime or a live TradingView chart.
Read the complete example
The sample closes are 100, 101, 100, 102, 101, 104, 103, 106, 105, 104, 102, 101, 103, 105, 104, 107. The first EMA value is 100. Each following value uses: new EMA = close × weight + previous EMA × (1 − weight), where weight = 2 ÷ (length + 1).
Length 20 gives each new close about 9.5% weight; length 50 gives it about 3.9%; length 100 gives it about 2.0%. A larger length gives each new close less influence. Changing this value does not change the price data.
On these fixed prices, the final EMA values are 20: 102.86; 50: 101.53; 100: 100.86. The price at the final close is 107. A real chart has its own price history, so these illustrative values are not expected TradingView results.
Turn the number into a setting
Section titled “Turn the number into a setting”You can add an EMA length field to the indicator’s settings. Then you can change the length without editing the code each time.
Replace the length line with an input
Copy the one-line excerpt below. In Pine Editor, select the whole line int length = 20 and replace it with this line. Keep the other lines.
There is one length line, beginning int length = input.int(...).
Save with Cmd+S or Ctrl+S, then update the chart if the editor offers that control.
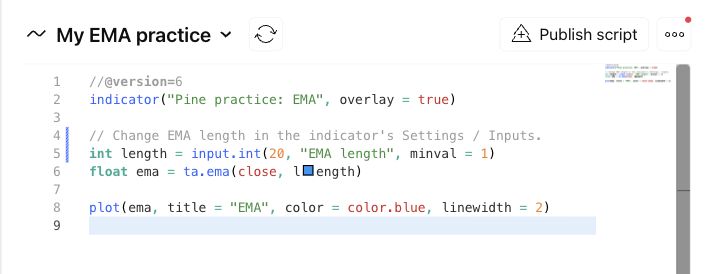
Open your indicator's settings
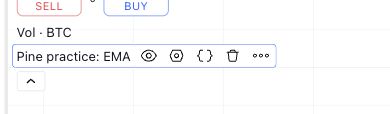
Move your pointer over Pine practice: EMA in the chart’s indicator list. Click its Settings gear.
The settings dialog belongs to Pine practice: EMA. It is not the chart's general settings dialog.
Change the EMA length field
Click the Inputs tab. In EMA length, replace 20 with 50, then click Ok.
The EMA recalculates with length 50, while your source code can keep 20 as its starting value.
No EMA length field? Check that you opened this indicator’s settings and saved the input.int(…) change from step 14. Opening the chart’s general settings will not show this field.
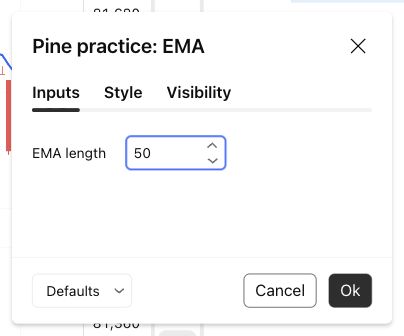
Open the same field again and return it to 20 before lesson 2. The value currently selected in Inputs controls this chart instance. The 20 in the code is its default, not a display of your current setting.
Complete script with the input field
Section titled “Complete script with the input field”If you need to restore the finished lesson, copy this complete version into Pine Editor, save, and add or update it on the chart.
Read only what you need
Section titled “Read only what you need”You have already used the code. These are the parts worth recognising now:
| What you see | What it means here |
|---|---|
//@version=6 |
The Pine Script version. Keep this first line. |
// Change the number... |
A comment for the reader. It does not change the calculation. |
int length = 20 |
The whole-number value you changed. |
input.int(...) |
The whole-number settings field you added. |
ta.ema(close, length) |
The calculation behind the blue line. |
plot(...) |
The instruction that draws the line. |
The version line also starts with //, but its @version annotation has a special purpose. Keep it intact. More detail: TradingView’s first steps and input settings.
If an edit does not work
Section titled “If an edit does not work”Start with the last line you changed. Read the editor’s error, then check:
- Missing or extra code: replace everything with the matching complete example above.
- A name changed:
lengthandLengthare different. Restore the exact spelling. - A quote or bracket disappeared: keep both quotes around text and the closing
)after a function call. - Only the chart looks wrong: check the indicator’s name, visibility and current EMA length input before changing more code.
Undo your last edit with Cmd+Z or Ctrl+Z if needed. Do not continue to alerts until this indicator draws correctly.