
Find where an alert stopped
Follow one event from TradingView to PineConnector and the broker, then investigate the first missing or unexpected result.
Builds on: Verify the demo outcome


An unexpected result is easier to diagnose when you follow one event through each service. Use the same alert name, event time, timezone and intended broker account throughout this lesson.
You will inspect evidence that already exists. Do not resend a trading message just to see whether it works the second time.
Pause before changing an uncertain setup
Section titled “Pause before changing an uncertain setup”Pause the relevant saved alert
In TradingView’s Alerts list, find the alert involved in the unexpected result. Right-click that row and choose Pause. Check for Stopped manually.
Use the alert that belongs to this setup. The picture below demonstrates the control with the earlier practice alert.
The selected automation shows Stopped manually. Existing broker positions still need their own check.
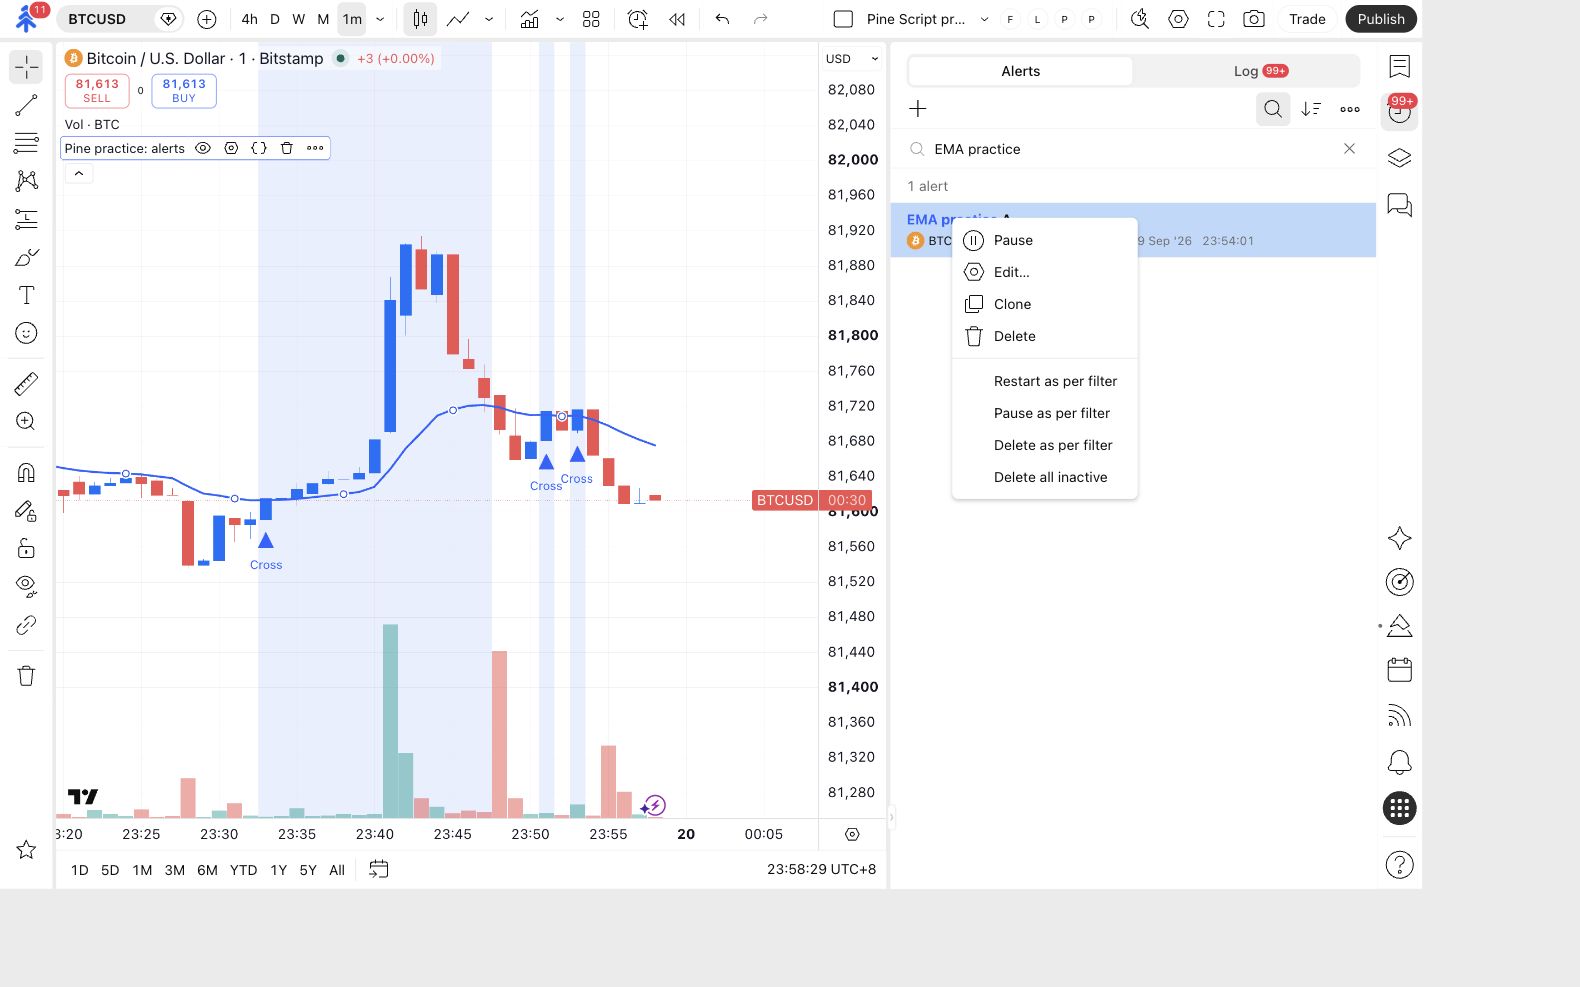
Pausing an alert does not close a position or cancel a pending broker order. Before a later retry, inspect positions, pending orders and history in every intended receiving account sharing the License ID. A missing notification is not proof that the first request failed.
Find the first missing checkpoint
Section titled “Find the first missing checkpoint”| What you can establish | Investigate next |
|---|---|
| No matching TradingView event | The saved alert’s condition, status and script. |
| TradingView event, no matching PineConnector record | Webhook configuration, delivery and destination. |
| PineConnector record with an error or unexpected processing | The full processing detail and receiving configuration. |
| Processing record, but no expected broker result | The intended account’s positions/history and terminal or broker logs. |
| Broker result exists but is wrong or duplicated | Actual message values, receiving scope and other active senders. |
A chart marker is not one of the delivery checkpoints. A green status at an earlier stage does not replace the later checks.
1. Read the actual TradingView event
Section titled “1. Read the actual TradingView event”Open Log and match the time
Click Log beside Alerts. Locate the relevant alert name and time. Open its entry and inspect the message that actually fired.
Write down its timestamp and timezone. Keep any License ID or signal secret in the message private.
You either find the actual generated message or establish that no matching event is visible.
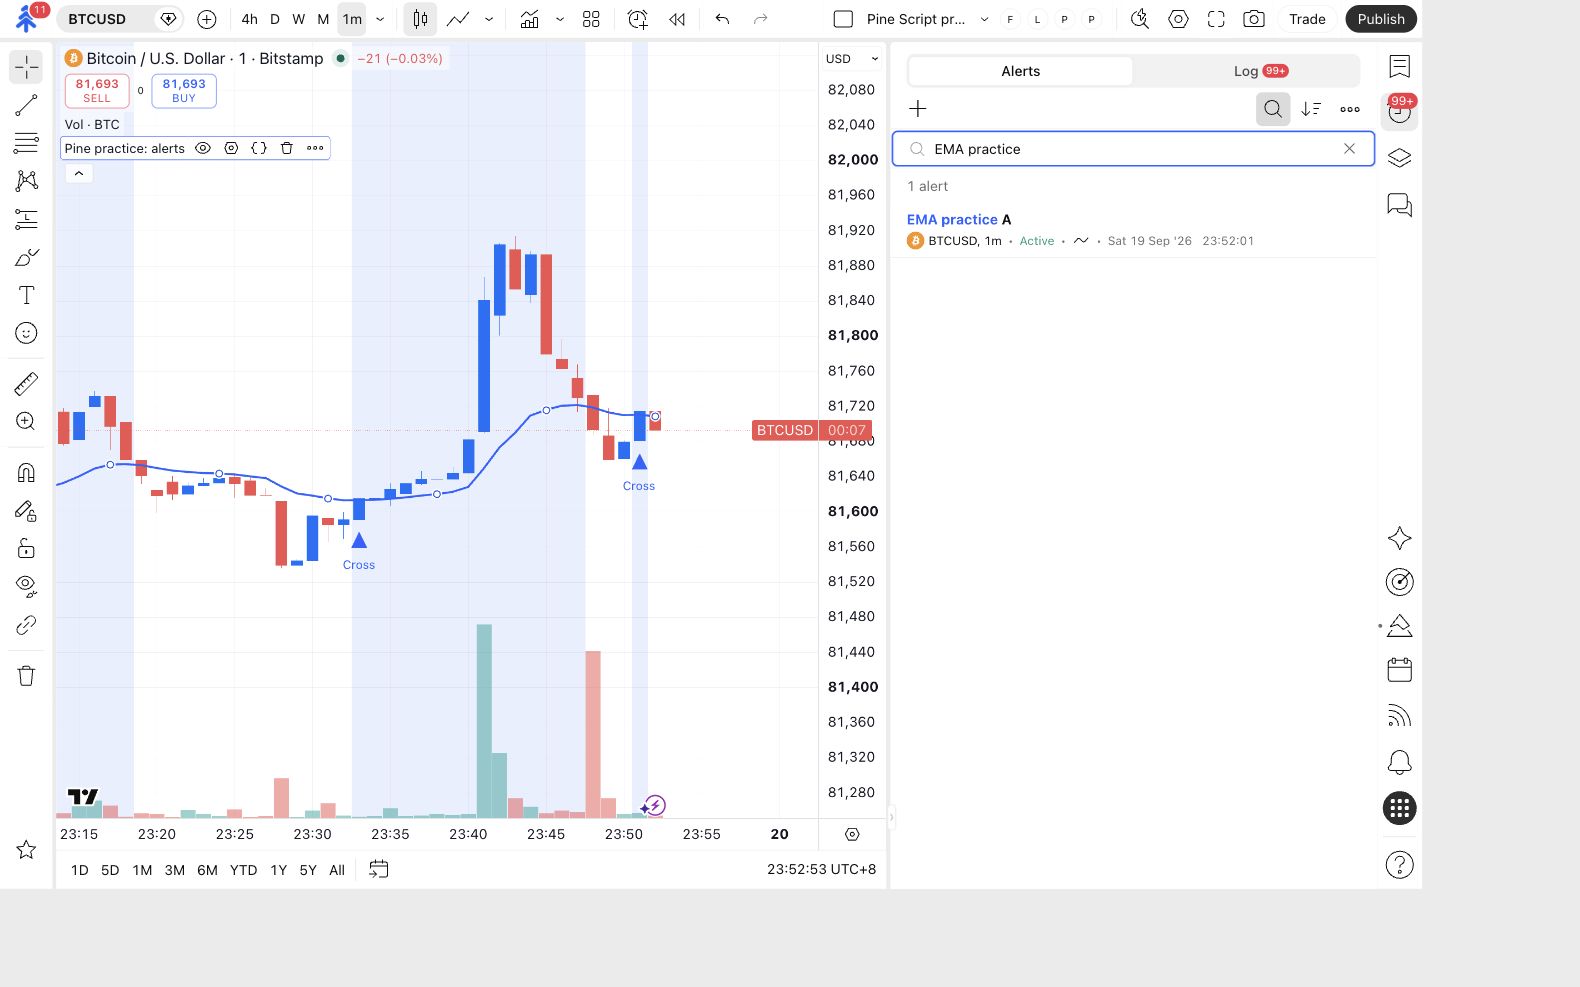
No matching entry? Check the saved alert’s status, expiration, symbol, interval, inputs and selected event. A closed-candle script needs a new qualifying event after alert creation. A compile or runtime error also needs fixing before it can run as intended.
Match the event type to the code:
| Your source uses | The corresponding alert choice |
|---|---|
Indicator alert(...) calls |
Any alert() function call. |
Indicator alertcondition(...) |
The intended named condition. |
| Strategy signal calls | The alert() calls route described by that strategy. |
| Strategy order-fill messages | The order-fills route, with its required message placeholder. |
This captured Crossing choice is the wrong route for an indicator’s alert(...) calls:
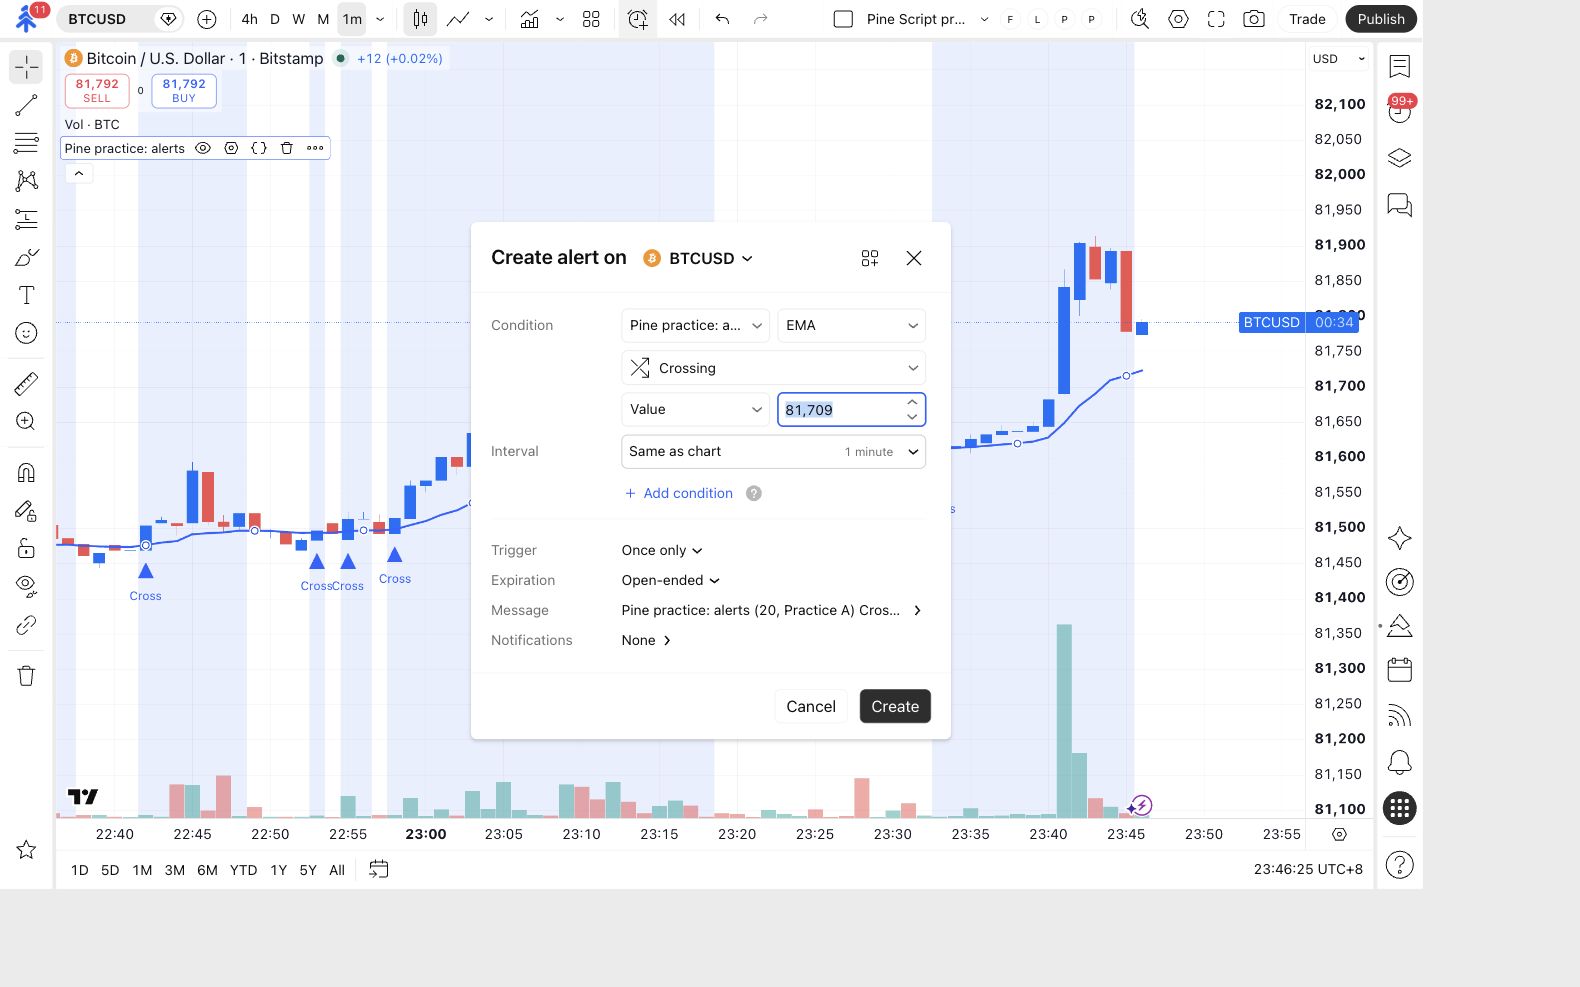
The chart now has different inputs? The alert may still be using its older saved copy. Follow Update your automation after recording the evidence. Do not assume editing the chart has repaired the running alert.
TradingView says the alert may not function as intended
Open the warning and its help link. TradingView warns that differences between historical and realtime script behaviour can make alerts disagree with the chart.
Keep broker-connected alerts paused while investigating. For a text-only check with Webhook URL off, compare a confirmed realtime event with its alert-log entry. Then reload the chart and inspect the same bar again. If its marker changes or disappears, investigate the script’s timing and data requests before connecting it.
Waiting for a chart bar to close does not establish that every part of a custom script is non-repainting. One matching example also does not prove universal behaviour. Read TradingView’s explanation of the custom-script warning.
2. Check delivery and the destination
Section titled “2. Check delivery and the destination”If the event exists, compare its actual message with the destination you intended. Check the License ID, exact broker symbol, command, sizing and any required authentication. The License ID is not the broker account number.
Open the alert’s Notifications settings and check whether Webhook URL was enabled with the destination in PineConnector Syntax. An earlier text-only course alert intentionally had that option off and therefore cannot prove a PineConnector delivery failure.
Use TradingView’s webhook delivery detail where available. Keep the reported error or delay with the event time. Then check the intended connections in Portal → Connections. One ID may address more than one account.
3. Match the record in Bridge
Section titled “3. Match the record in Bridge”Find the same event in PineConnector
Open Portal → Bridge. Find the entry for the same event time and receiving account. Open its details and read the complete processing result.
A matching record identifies the intended account, action and symbol, with a processing result you can inspect.
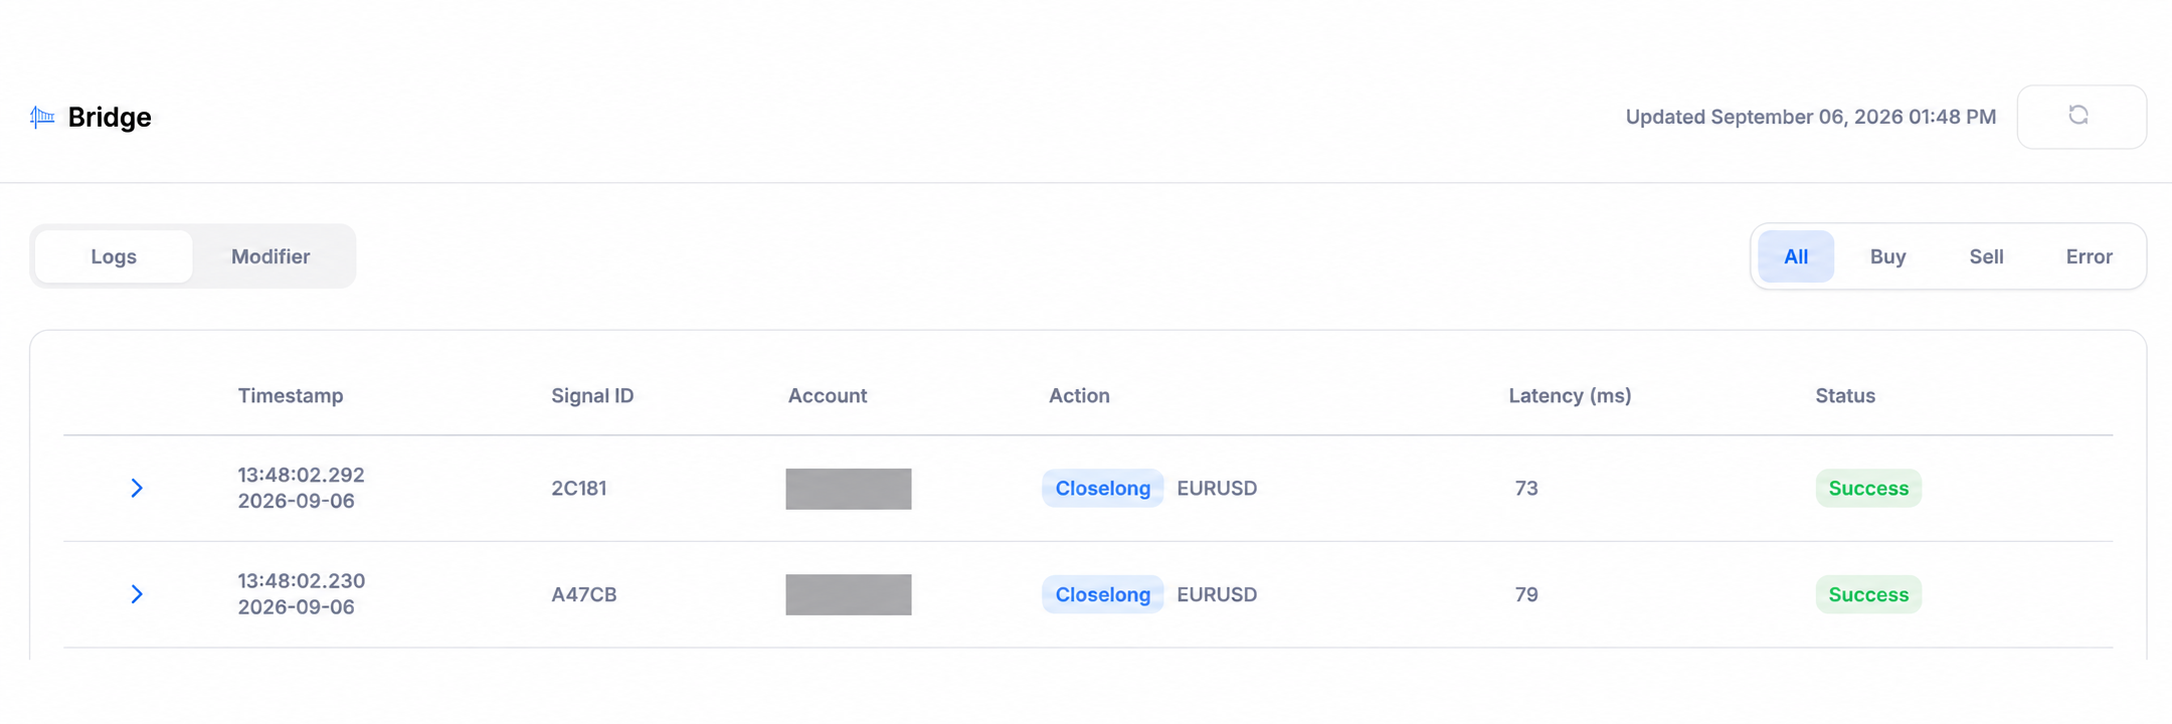
Missing record? Recheck delivery and routing rather than changing the EMA. Error present? Keep the complete text, including the words beside an error number, and use EA errors. Do not classify every missing order as a Pine condition problem.
4. Inspect the broker outcome
Section titled “4. Inspect the broker outcome”Check positions and history on the receiving account
Open that same account in its supported MT5 interface. Inspect Trade/positions, pending orders and account history. On desktop MT5, the Trade tab is in the lower Toolbox.
Compare the exact symbol, direction, actual volume and accepted stops or targets with the message. For a close request, check which position closed and what remains.
You can state what actually happened at the broker, including whether the position already opened or closed.
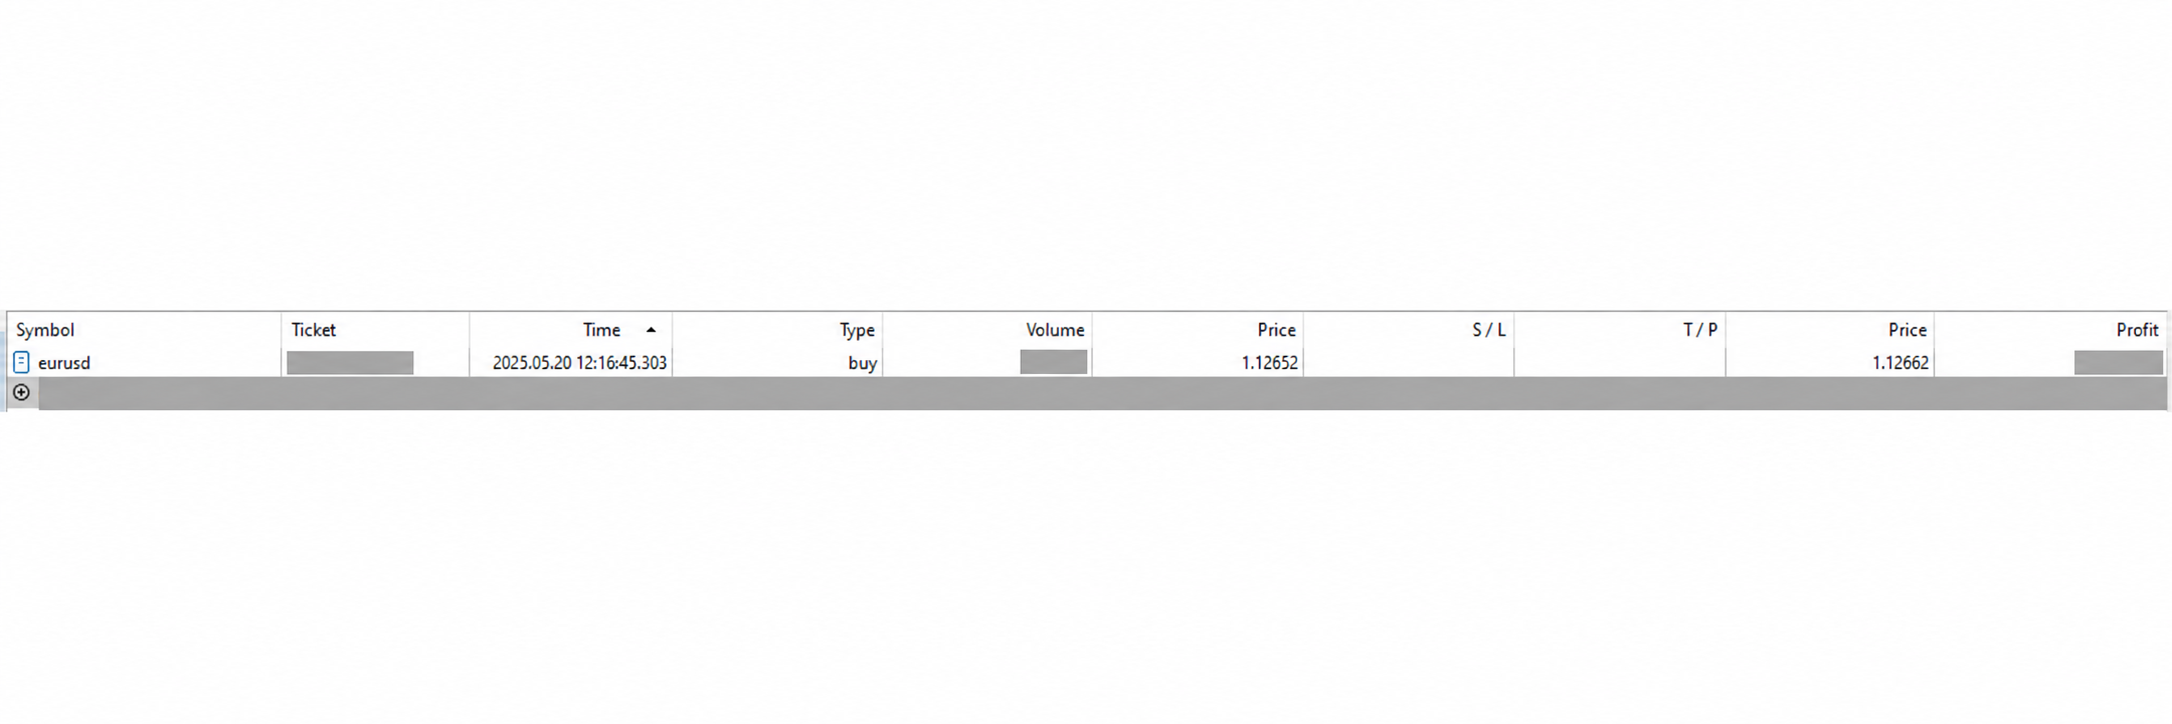
If the expected result is missing or different, inspect Experts and Journal at the same time. On Edge, open your instance in Portal → Edge and use its log tabs. For a self-hosted terminal, open the corresponding MT5 tabs.
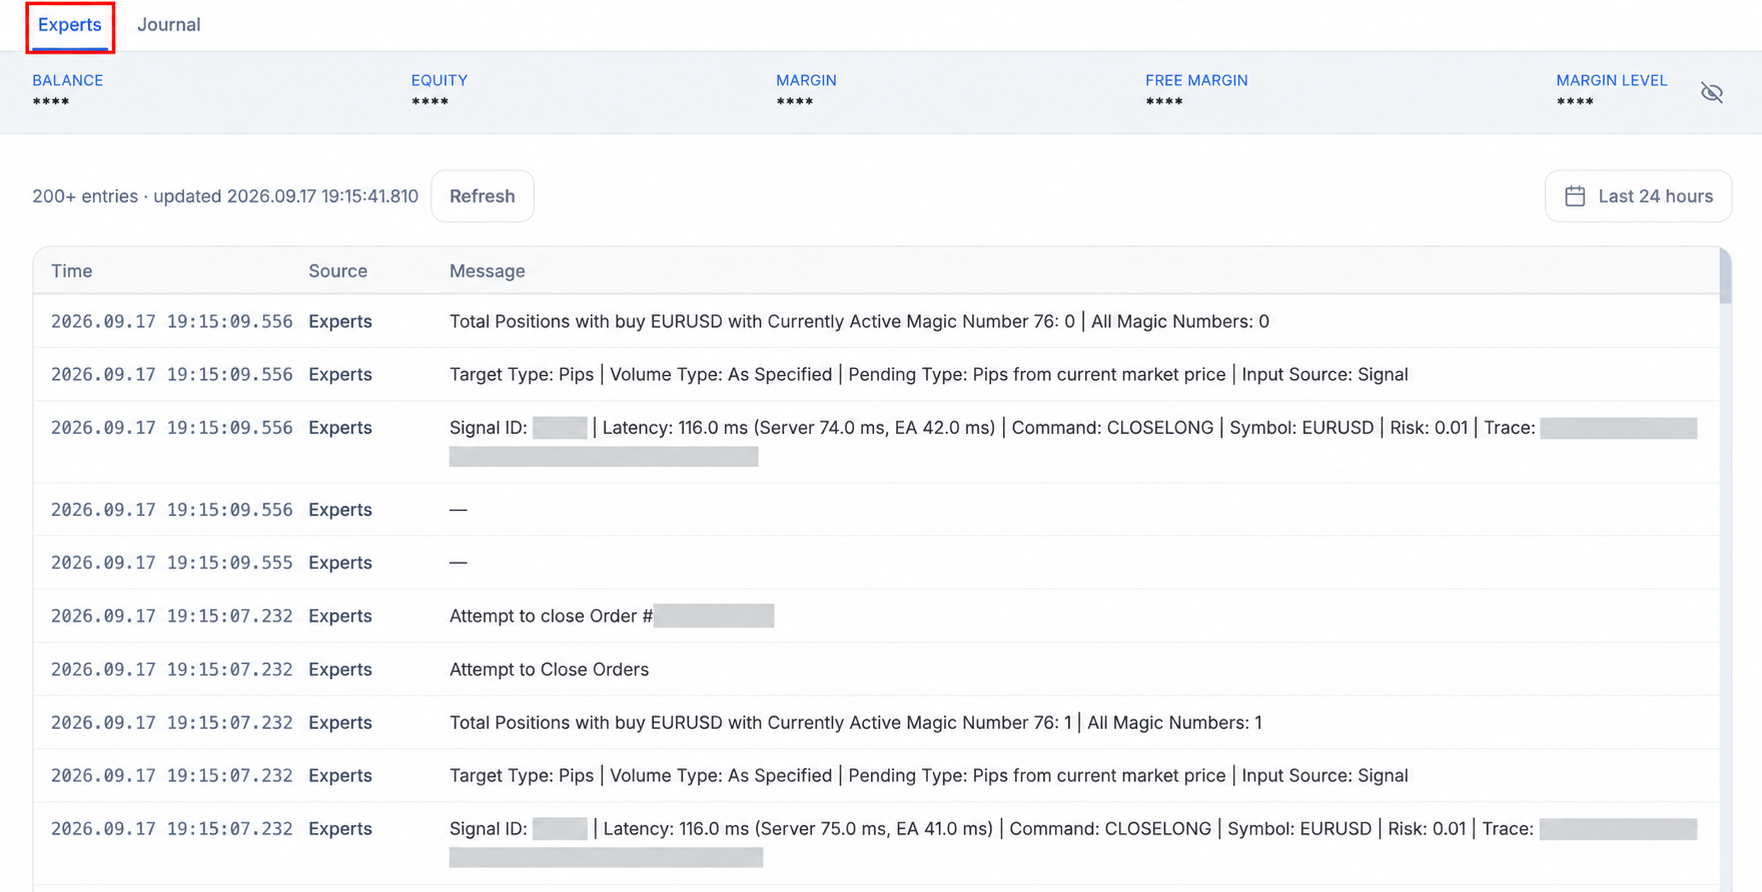
Unexpected duplicate? Check active TradingView alerts, accounts sharing the ID, and repeated EA instances in a self-hosted terminal. Wrong size or protection? Compare explicit units and receiving settings. An unrelated position closed? Check command scope and the strategy-separation rules before another request. Full troubleshooting guide
Decide the next action from the evidence
Section titled “Decide the next action from the evidence”Keep the affected alert paused while the outcome is uncertain. Resolve the first missing or incorrect stage, check the broker account before any retry, then follow Verify your demo setup for a deliberate new test.
For support, prepare the event time and timezone, expected versus actual result, relevant processing record and full error text. Review screenshots for secrets and unnecessary account details. Use PineConnector Support for account-specific help.
Check yourself
Section titled “Check yourself”Question: TradingView has a log entry, but its webhook was off. Should you rewrite the crossover condition?
Show the answer
No. The condition produced an event. Investigate the configured delivery route. First check the broker state and keep the old alert paused before preparing a corrected demo test.
Question: Bridge shows processing success, but you have not checked the broker. Is the whole path verified?
Show the answer
No. Inspect the intended account’s positions and history, and compare symbol, direction, size, protection and duplicates. Processing and broker outcome are separate evidence.