
Understand a Pine Script strategy
Add a simple strategy, find its simulated trades, and compare the signal candle with the fill candle.
Builds on: Conditions and signals


You have used Pine to draw signals. A strategy also asks TradingView to simulate orders and records the results. In this lesson, you will find one simulated entry and exit and explain when each happened.
Use the BITSTAMP:BTCUSD, 1-minute, Candles chart from the earlier lessons. You need to recognise entry and exit conditions. This exercise stays inside TradingView’s simulator; it needs no connected broker account or webhook.
Add a separate strategy practice file
Section titled “Add a separate strategy practice file”Open Pine Editor
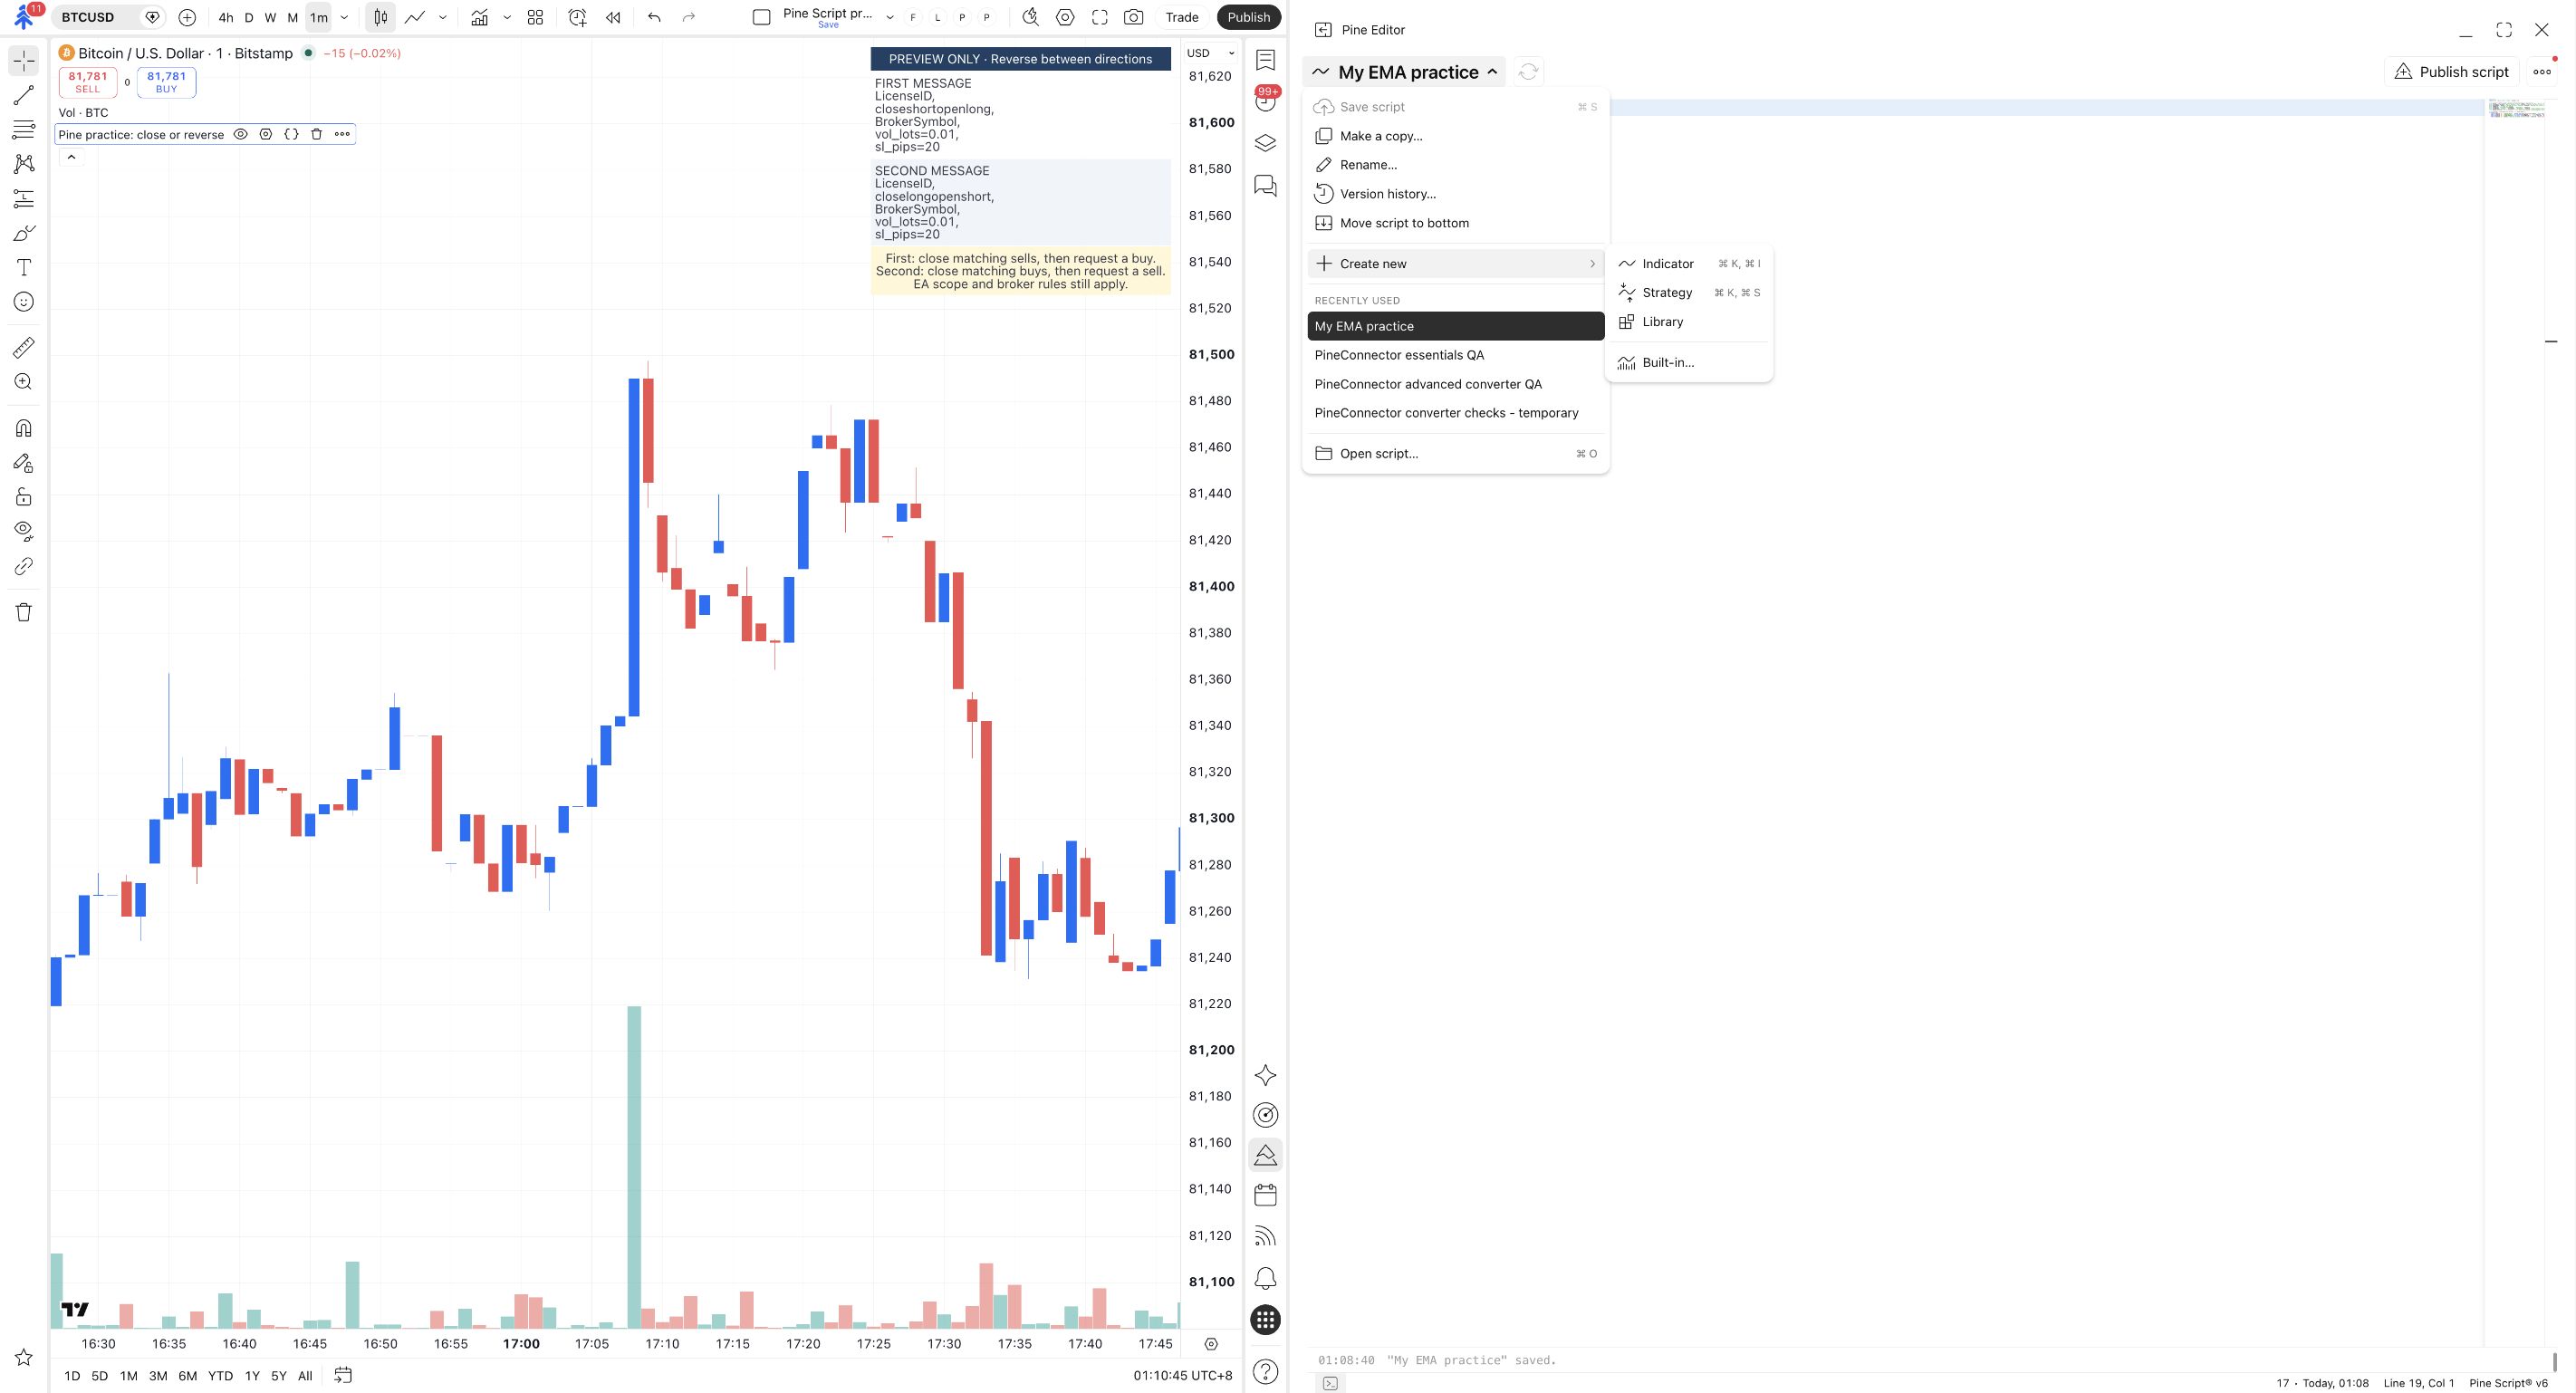
Click Pine in the right toolbar. Open the script-name menu and choose Create new → Strategy. Keep My EMA practice saved for the indicator lessons.
The editor is open beside your chart.
Copy the complete strategy
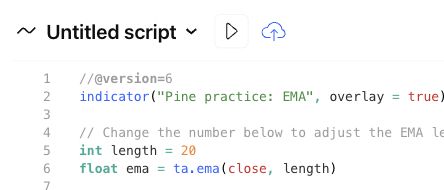
Section titled “Copy the complete strategy”Click Copy below. Back in TradingView, click inside the new editor, select all with Cmd+A / Ctrl+A, and paste over the starter code.
Save and add it to the chart
Click the cloud-shaped Save control. Name this new file My strategy practice and click Save. Then click the triangle-shaped Add to chart control beside the script name.
The chart lists Pine practice: strategy, with an EMA and Entry/Exit condition markers.
If the chart is crowded, hover over the earlier practice indicator’s name and use its eye control to hide it. Keep the new strategy visible.
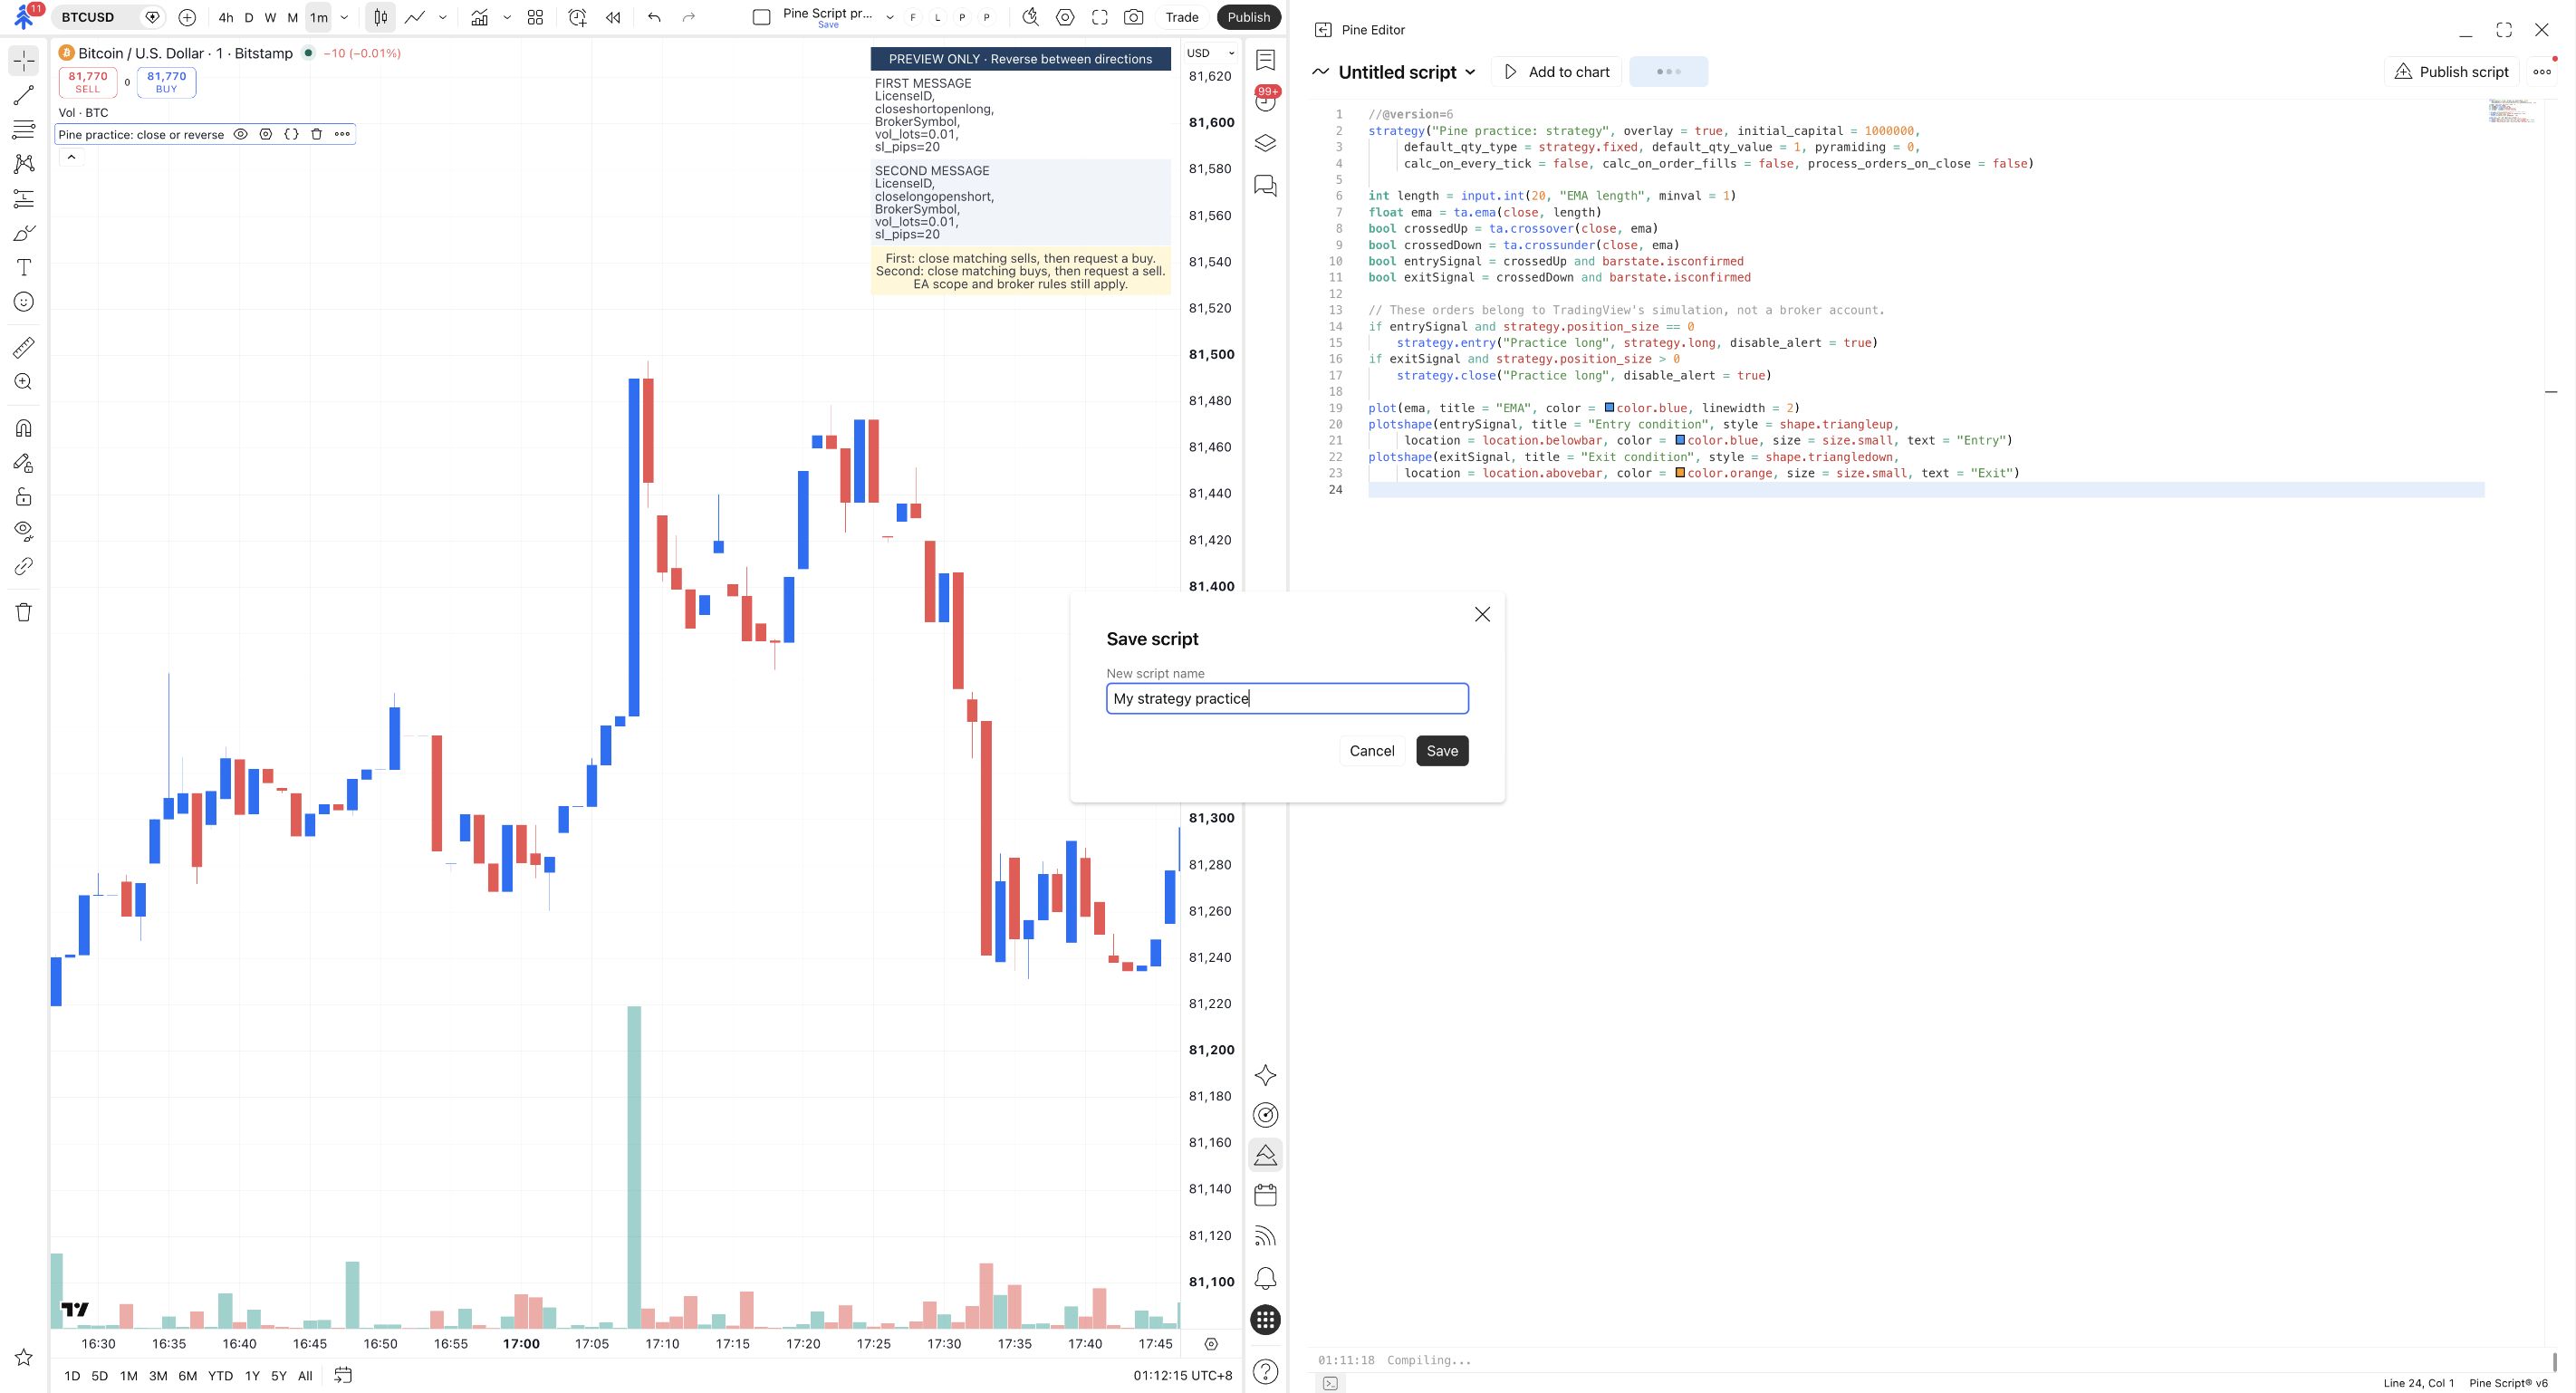
The saved file is My strategy practice. The chart label Pine practice: strategy comes from the strategy(...) declaration. That declaration is also what distinguishes this complete script from the earlier indicator(...) examples.
Find a simulated entry and exit
Section titled “Find a simulated entry and exit”Open the strategy's Trades view
Adding the strategy opens its report beneath the chart. Check that the report selects Pine practice: strategy. Click the table-shaped button near the report’s top left; its tooltip says Trades.
The report heading reads List of trades, with Entry and Exit rows for closed simulated trades.
If several strategies are loaded, use the strategy-name dropdown at the top of this report to select the practice strategy first.
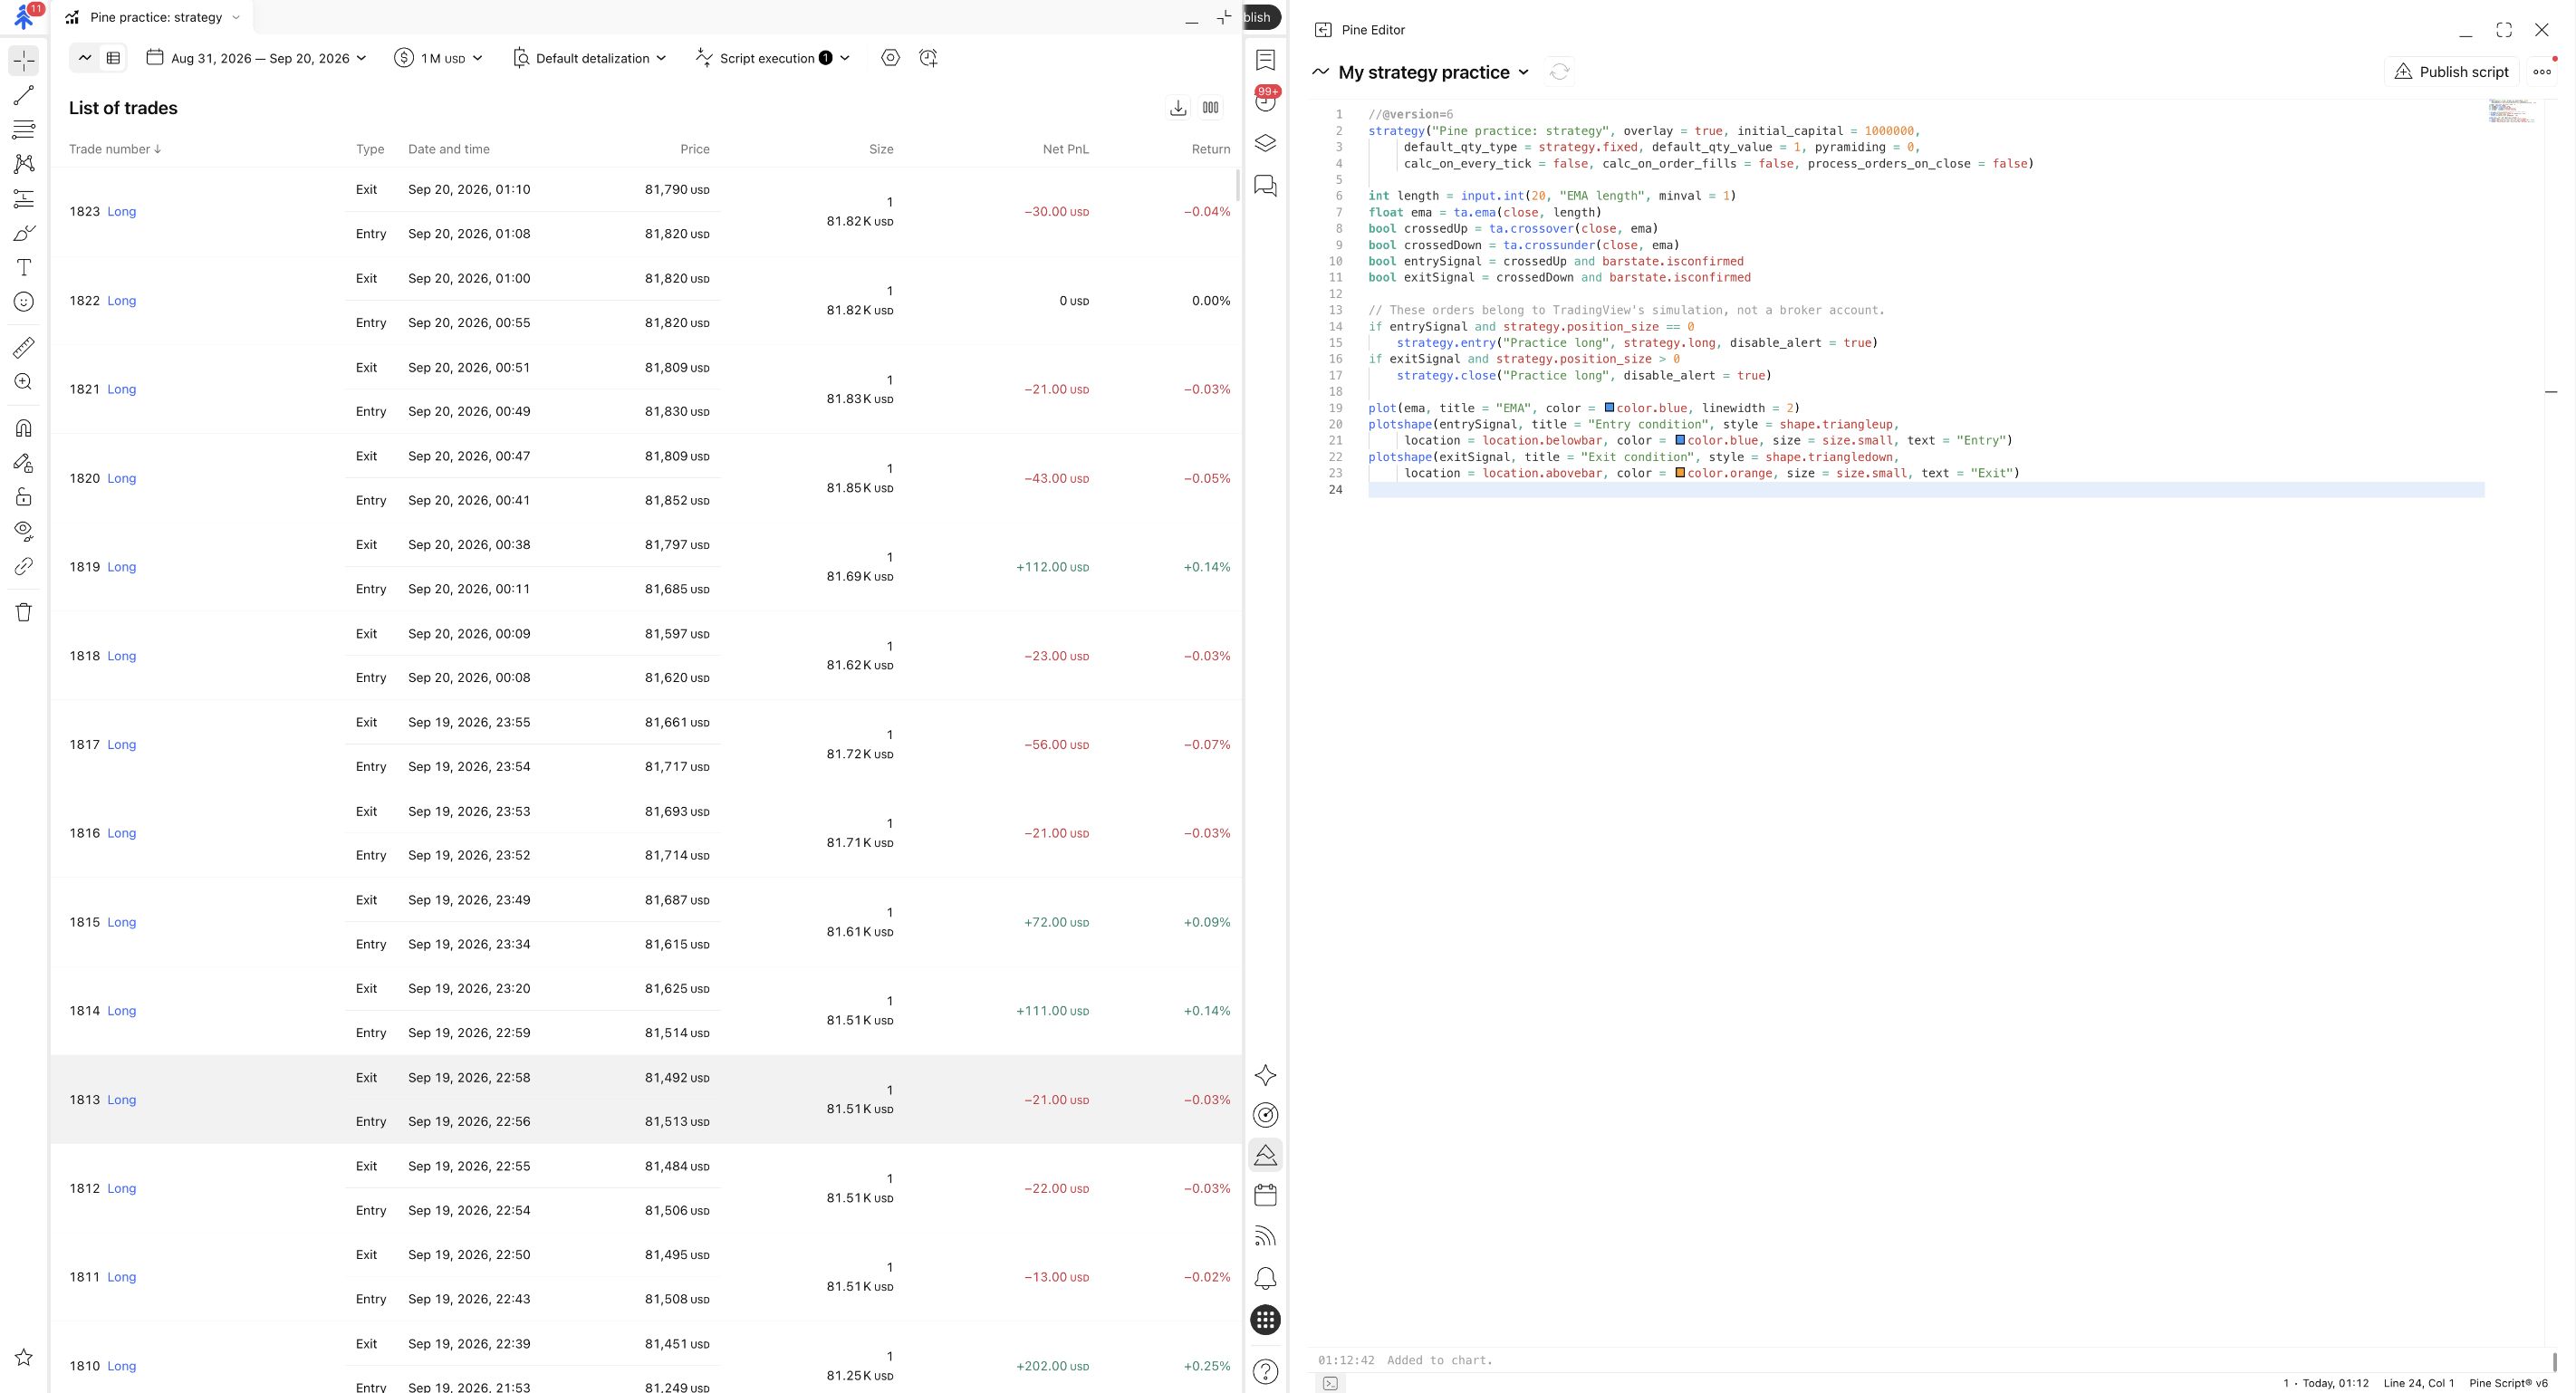
Choose a closed trade in List of trades. Read its Entry and Exit rows together, including their times and Size. Your dates and prices will differ from the captured example.
My older layout says Strategy Tester
Use that panel’s List of trades view. The task is the same: select the practice strategy and inspect one completed simulated entry and exit.
Find these parts in the code, then compare them with the selected trade:
| Code | What this example asks TradingView to simulate |
|---|---|
strategy.entry("Practice long", strategy.long, ...) |
Open a long trade when the confirmed upward cross occurs and the simulated position is flat. |
strategy.close("Practice long", ...) |
Close that entry when a confirmed downward cross occurs. |
strategy.position_size |
Read the strategy’s simulated position when deciding whether to enter or close. |
The matching Practice long text connects the entry and close inside this simulation. It is not a PineConnector License ID or an identifier for a MetaTrader trade.
No trades shown? Confirm the selected script is the strategy, that it compiled, and that the loaded price history contains a qualifying cross. Inspect its Settings → Properties if the simulated capital or order size was changed. A compile error is handled in Find and fix a script error.
Compare the condition candle with the fill
Section titled “Compare the condition candle with the fill”Find an Entry triangle drawn by the script. Then locate TradingView’s simulated entry marker or the corresponding entry time in the report.
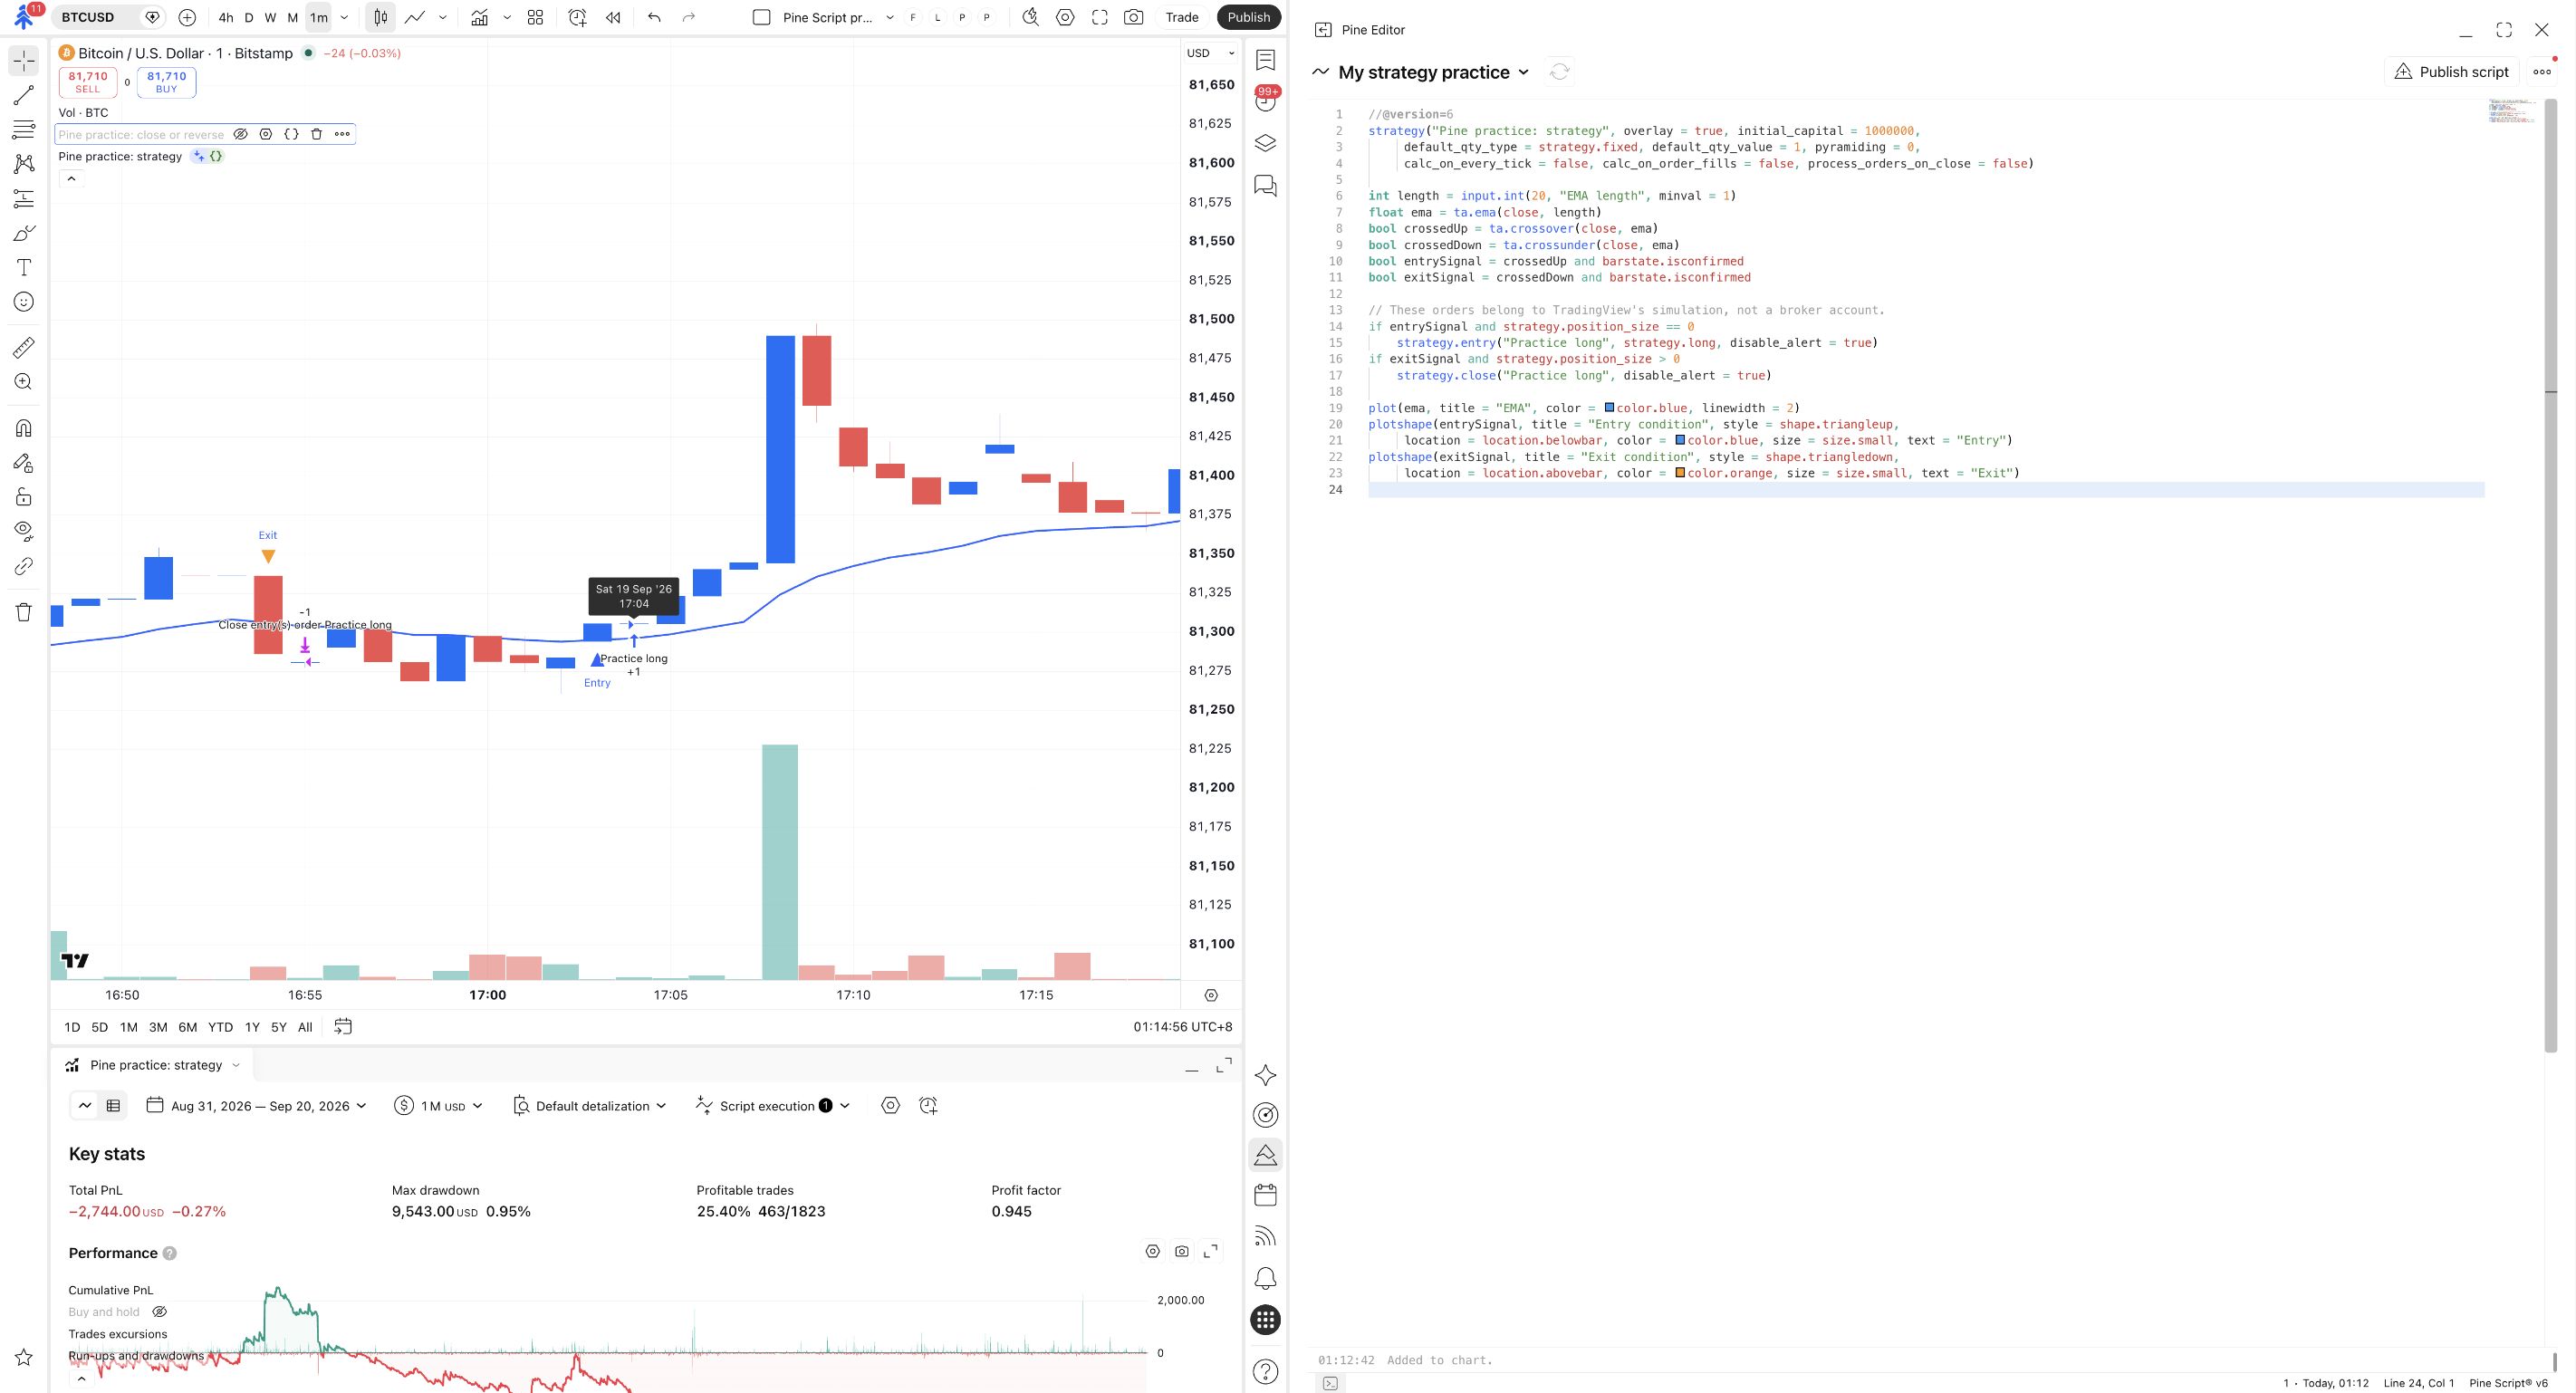
With this script’s settings, the condition is checked at the candle close. The resulting market order is normally filled at the next bar’s open. The same distinction applies to the exit. A condition marker and a simulated fill therefore need not share the same candle or price. TradingView’s order-timing explanation
Hover over Pine practice: strategy on the chart, open its Settings gear, and select Properties. In the captured current interface, Script execution is On bar close and Order execution delay is One tick. Keep those settings for this exercise.
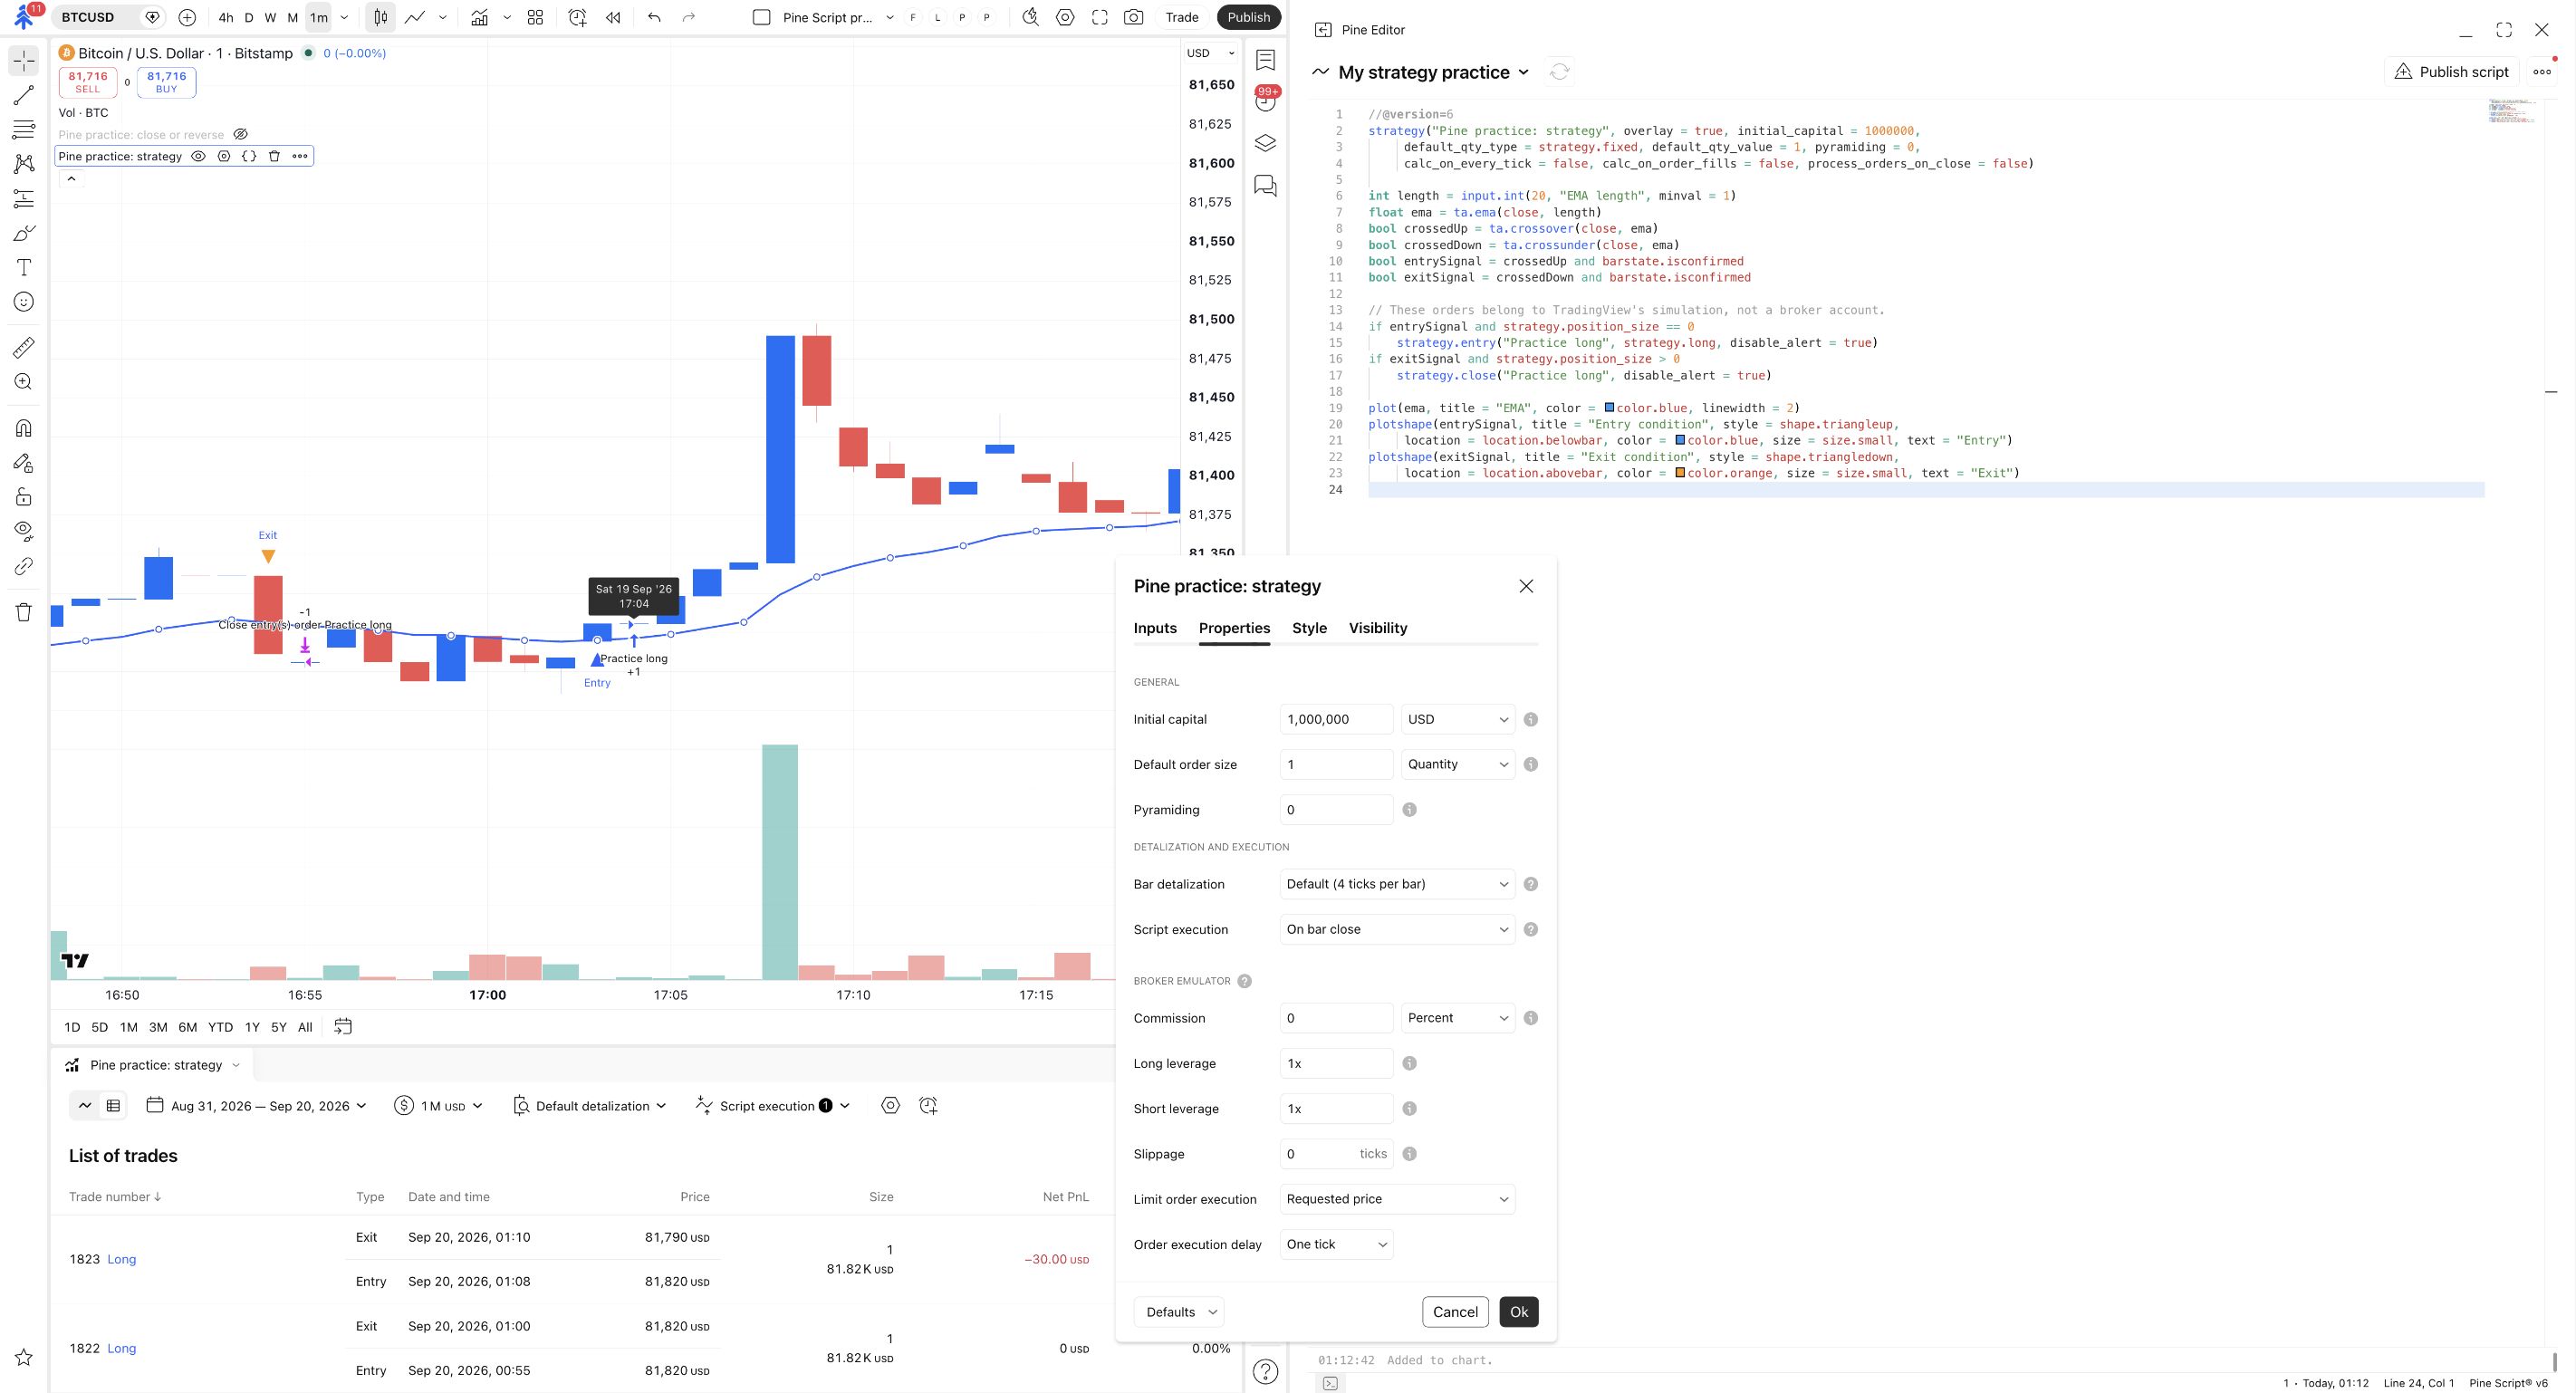
The source explicitly keeps calc_on_every_tick, calc_on_order_fills and process_orders_on_close false. The current interface groups execution choices in a menu; leave additional order-fill, history-tick and realtime-tick execution unselected. Changing these choices changes the timing you are comparing.
Try it yourself
Section titled “Try it yourself”Choose one closed trade. Identify the entry-condition candle, simulated entry, exit-condition candle and simulated exit. Then predict: if you replaced the word Entry in plotshape(...) with Hello, would the strategy start buying at a different time?
Show the answer
No. That text labels the drawing. The order conditions and strategy.entry(…) call determine the simulated action. Changing a label is different from changing a rule.
Keep simulated quantity separate
Section titled “Keep simulated quantity separate”The source specifies a simulated order quantity of 1 and initial simulated capital of 1,000,000. Those are properties of this teaching example, not a suggested account balance or broker trade size. TradingView’s quantity unit depends on its symbol; it does not automatically mean one MetaTrader lot. Strategy properties